
- Problem: Snapshot-based insurance decisions.
- Solution: A living GeoAI-based evidence record.
- Benefit: Improved prevention, prioritization, response, renewal, and claims context.
An insurance policy may run for 365 days. Physical risk does not wait for renewal.
A slope begins to move. Vegetation grows toward a conductor. A contractor starts digging near a buried line. A small release stresses vegetation before it becomes obvious on the ground. A storm changes drainage, access, and asset condition in a single afternoon.
Yet the insurance file often remains largely frozen: last year’s engineering survey, a schedule of values, loss history, questionnaires, and a catastrophe model built from generalized assumptions. All are useful. None fully answers the question that matters most between renewal dates: What has changed? and what did the operator do about it?
That gap is becoming harder to defend. Swiss Re Institute estimates that natural catastrophes caused $107 billion in insured losses during 2025, the sixth consecutive year above $100 billion. Even more revealing, wildfires, severe convective storms, and floods (often called secondary perils) accounted for a record 92% of global natural-catastrophe insured losses. These are not only rare, singular catastrophes. They are recurring, distributed events whose consequences depend heavily on local conditions and preparation.
Insurers and the insured need more than a better snapshot. They need a living record of risk.
The Underwriting File Starts Aging Immediately
Traditional underwriting asks sensible questions: Where are the assets? What are they worth? Which hazards surround them? How have similar assets performed historically?
GeoAI adds a different class of questions: Is the hazard changing? Is exposure increasing? Is mitigation working? Which locations deserve attention now? Can the organization prove that it acted?
That distinction separates exposure data from operational evidence. A wildfire-risk map may show where fuels and infrastructure intersect. Recurring geospatial analytics can also show where vegetation is encroaching, where plant health indicates elevated concern, where clearing occurred, and where conditions changed after a storm. A susceptibility map may identify a landslide-prone corridor. Multitemporal analysis can help reveal whether the ground is actually moving and which assets lie in the developing zone of influence.
The purpose is not to replace catastrophe models, engineering inspections, adjusters, or field crews. AXA XL describes satellite data as a tool spanning underwriting, risk engineering, and claims, while still emphasizing that imagery should prioritize, not replace, physical inspection. The insurer has stated an ambition to use AI-powered imagery for remote surveys of roughly half of its property risks over time, alongside conventional site visits.
That is the right model: machines find change at scale; experts decide what it means and what to do next.
One Evidence Base, Many Insurance Decisions
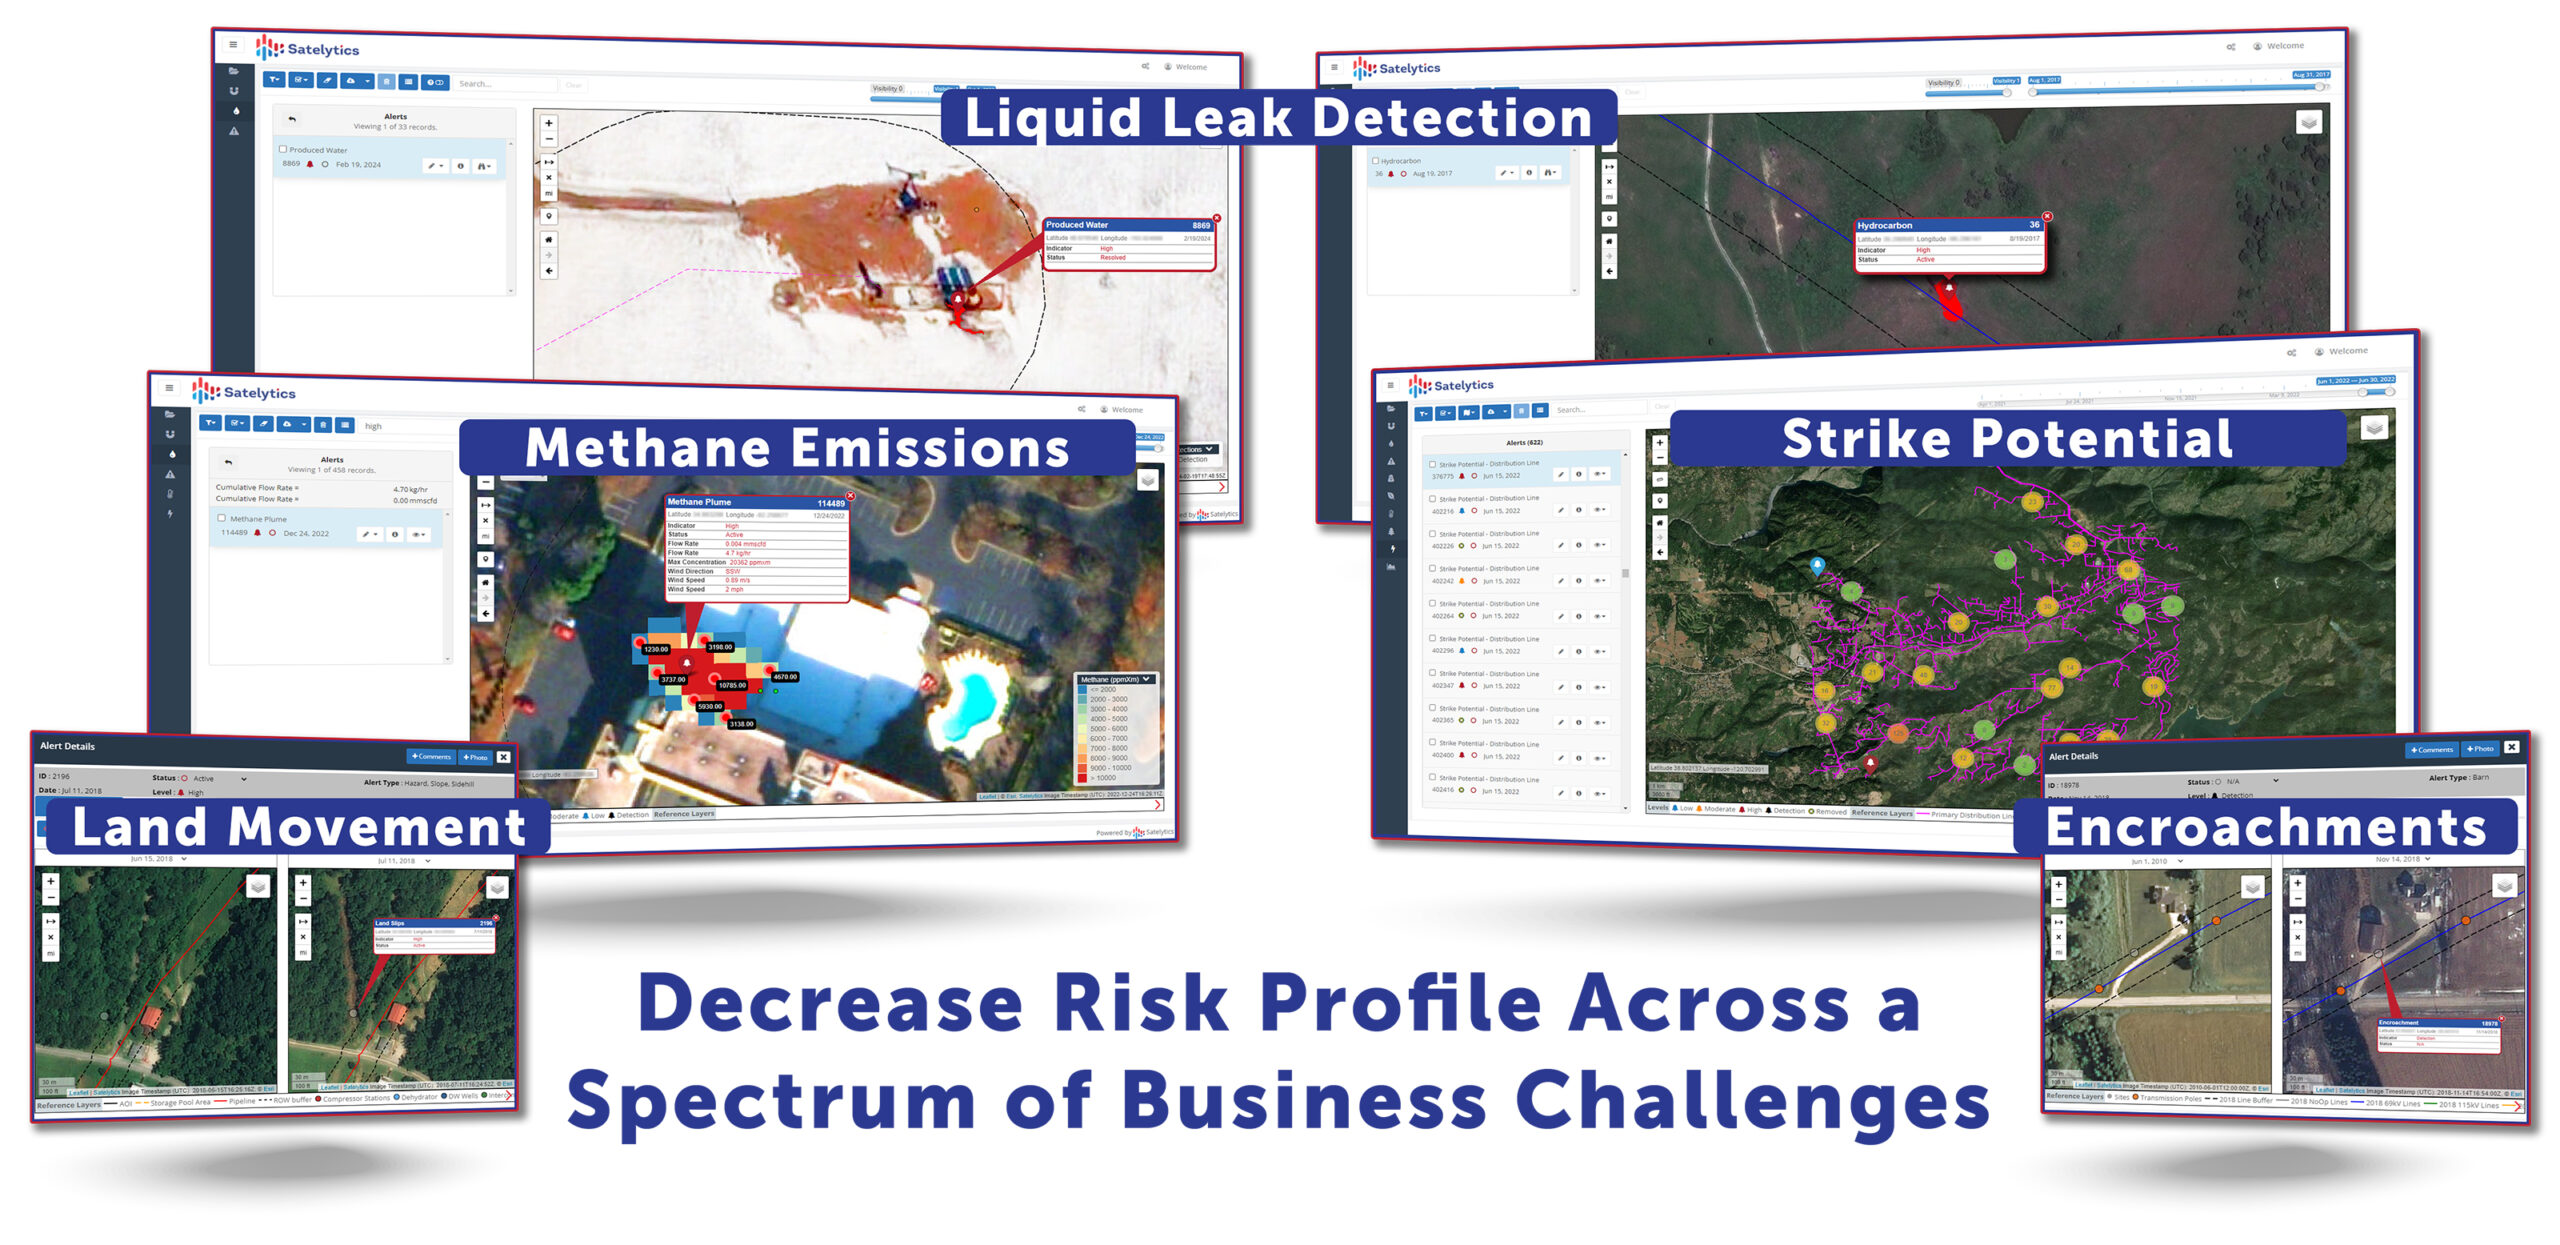
A multilateral GeoAI program does not look for only one problem. One imagery acquisition can support multiple analytical lenses across the same asset base.
For an electric utility, that might include vegetation encroachment, tree condition, wildfire fuel indicators, storm damage, land movement, and new construction near rights-of-way. For a pipeline or oil and gas operator, it can include methane, liquid hydrocarbons, produced water, vegetation stress, erosion, slope movement, and third-party activity. Water, wastewater, and mining operators can add chemical indicators, plume extent, tailings conditions, reclamation progress, and receiving-water impacts.
This matters to insurance because losses rarely respect organizational silos. A moving slope is not solely a geotechnical issue if it strains a pipeline, triggers a release, contaminates water, blocks access, and interrupts service. A vegetation problem is not solely a maintenance issue if it contributes to ignition, outage, business interruption, liability, and reputational damage.
Analyzing those conditions together creates more than a list of alerts. It creates corroboration. Movement detected over time becomes more meaningful when evaluated with rainfall, vegetation change, asset location, maintenance history, and field confirmation. A suspected release becomes more actionable when spectral evidence, plant stress, drainage direction, operating data, and a technician’s observation point toward the same conclusion.
That is the deeper promise of multilateral analytics: not simply more answers for one acquisition cost, but multiple lines of evidence supporting one defensible decision.
Four Moments That Matter
A living risk record can strengthen four distinct moments in the insurance lifecycle.
At underwriting, GeoAI can establish a current baseline across an entire portfolio, including remote sites that are uneconomic to inspect frequently. It can help identify concentrations, anomalies, and locations that warrant deeper engineering review.
During the policy period, recurring monitoring can show whether conditions are stable, deteriorating, or improving. It can also document completed mitigation: vegetation cleared, erosion stabilized, encroachment addressed, a leak repaired, or a disturbed area restored.
After an event, before-and-after analysis can help delineate storm, flood, fire, spill, or ground-movement impacts, even where access is restricted or unsafe. The European Union Agency for the Space Programme notes that Earth observation already supports risk assessment, index calculation, damage assessment, and claims management. Its joint work with the European insurance supervisor also cautions that satellite-derived loss estimates are most valuable when combined with ground evidence, claims records, and model outputs.
At claim or renewal, the same time-stamped record can provide evidence of pre-loss condition, event extent, response, and continuing improvement. That does not predetermine coverage or liability. It improves the quality and chronology of the facts available to everyone involved.
Prevention Should Be Visible
Insurance has always rewarded some forms of mitigation: sprinklers, alarms, firebreaks, inspections, maintenance programs, and engineering controls. The next step is making the condition and performance of those controls more observable across large territories.
The economic logic is established. A National Institute of Building Sciences analysis cited by FEMA found that federal natural-hazard mitigation grants save an average of $6 in future disaster losses for every $1 invested. The exact return will differ by asset, peril, and intervention, but the direction is unambiguous: prevention can be materially less expensive than recovery.
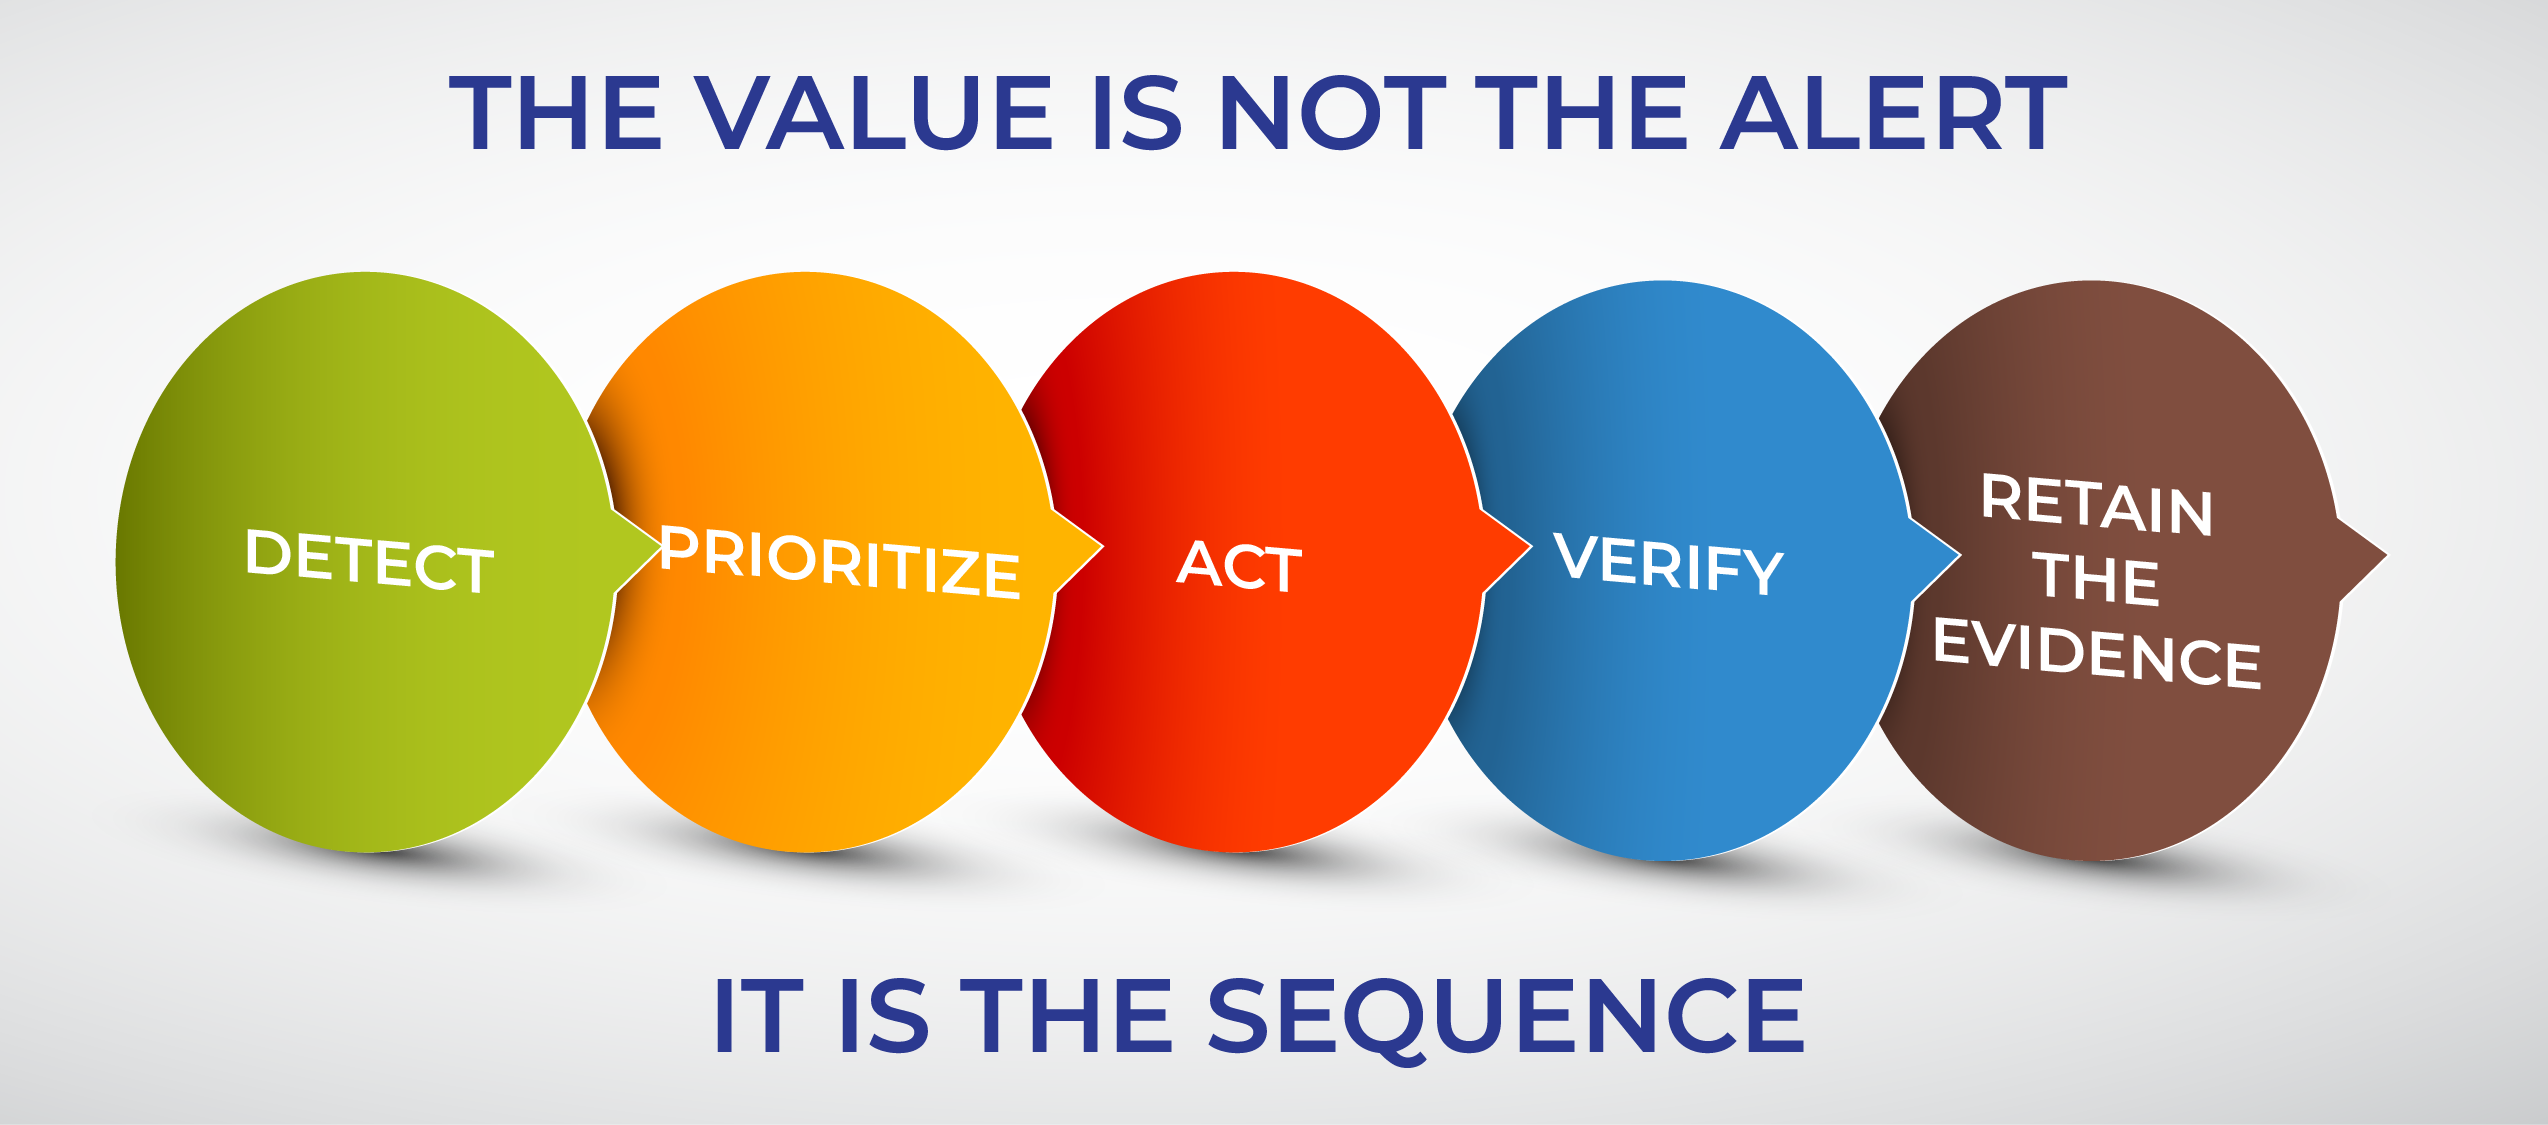
GeoAI helps close the evidence loop. It can identify an emerging condition, direct an intervention, and then verify that the condition changed. The value is not the alert alone. The value is the sequence: detect, prioritize, act, verify, and retain the evidence.
That sequence also creates a healthier relationship among insureds, brokers, risk engineers, underwriters, adjusters, and reinsurers. Operators should not have to expose every item of sensitive operational data to prove responsible risk management. Role-based reporting can provide the right evidence to the right party: portfolio trends for executives, priority locations for field teams, mitigation status for risk engineers, and time-stamped event context for claims professionals.
Price the Risk and the Response
Insurance markets will harden and soften. Premiums will rise and fall with capacity, competition, loss experience, and reinsurance economics. A temporary change in price does not change the underlying need for better evidence.
The more important opportunity is to move insurance from an annual transaction toward a continuous resilience partnership. Underwriters gain a more current view of exposure. Insureds gain a clearer way to demonstrate control. Risk engineers can target scarce attention. Claims teams receive better event context. Reinsurers gain a more consistent view across portfolios.
The underwriting question should no longer be only, “What hazards surround this asset?” It should also be, “How quickly can this organization see risk changing, how intelligently does it respond, and can it prove the work was done?”
If an operator can demonstrate that risk was monitored, prioritized, and mitigated throughout the year, why should renewal still be priced from a once-a-year snapshot?