- Problem: Single use data is expensive.
- Solution: Re-analyze many times.
- Benefit: Reduce cost per solution, reduce procurement efforts.
Most infrastructure operators buy geospatial monitoring to solve one urgent problem: a methane compliance mandate, a liquid-pipeline leak rule, a vegetation-strike safety requirement, or a water-quality permit. What they often discover only after deployment is that the same satellite dataset, analyzed with different algorithms, can answer several other business questions at once. This “multiple solutions from a single set of data” pattern is not a marketing slogan; it is a repeatable, documented outcome across gas distribution, electric transmission, liquids pipelines, and water management customers, and it is reshaping how forward-looking operators think about the return on a single imagery contract.
The Economics of a Single, Narrow Focus
A single geospatial contract typically begins with a narrowly defined mandate tied to regulatory compliance or asset protection. Federal pipeline safety rules require operators to detect and repair methane and hazardous-liquid leaks quickly. The cost asymmetry between prevention and reaction is enormous. Waiting even 72 hours to detect a modest produced-water leak of 25 barrels per day can generate $750,000 to $1.5 million in environmental remediation alone, before fines, downtime, and investigation costs push the total past $2 million. On the liquids side, every hour a hazardous-liquid pipeline leak goes undetected costs the average operator approximately $52,000. These figures explain why the first purchase decision is almost always driven by risk avoidance rather than growth. But the same imagery pipeline used to satisfy that mandate carries far more information than a single algorithm extracts, and sophisticated operators are learning to mine it repeatedly.
Gas Distribution: from Compliance to Enhanced Revenue
A large multi-state gas distribution utility initially contracted for wide-area methane emissions monitoring across its service territory to meet leak detection and repair obligations. Once the monitoring cadence was established, the utility’s operations team realized the same imagery could be reprocessed to track construction milestones across new residential and commercial developments, identifying exactly when a site had reached the point where a utility connection could be made. Because natural gas distribution revenue is directly tied to the pace of new-customer connections, and infrastructure investment programs recover costs through rate mechanisms tied to construction timelines, even modest reductions in the connection-to-revenue lag translate into materially earlier billing starts and faster time-to-market for developers who depend on utility service to close sales. The utility did not need a new sensor, a new satellite pass, or a new contract line item. It needed a new question asked of data it already owned.
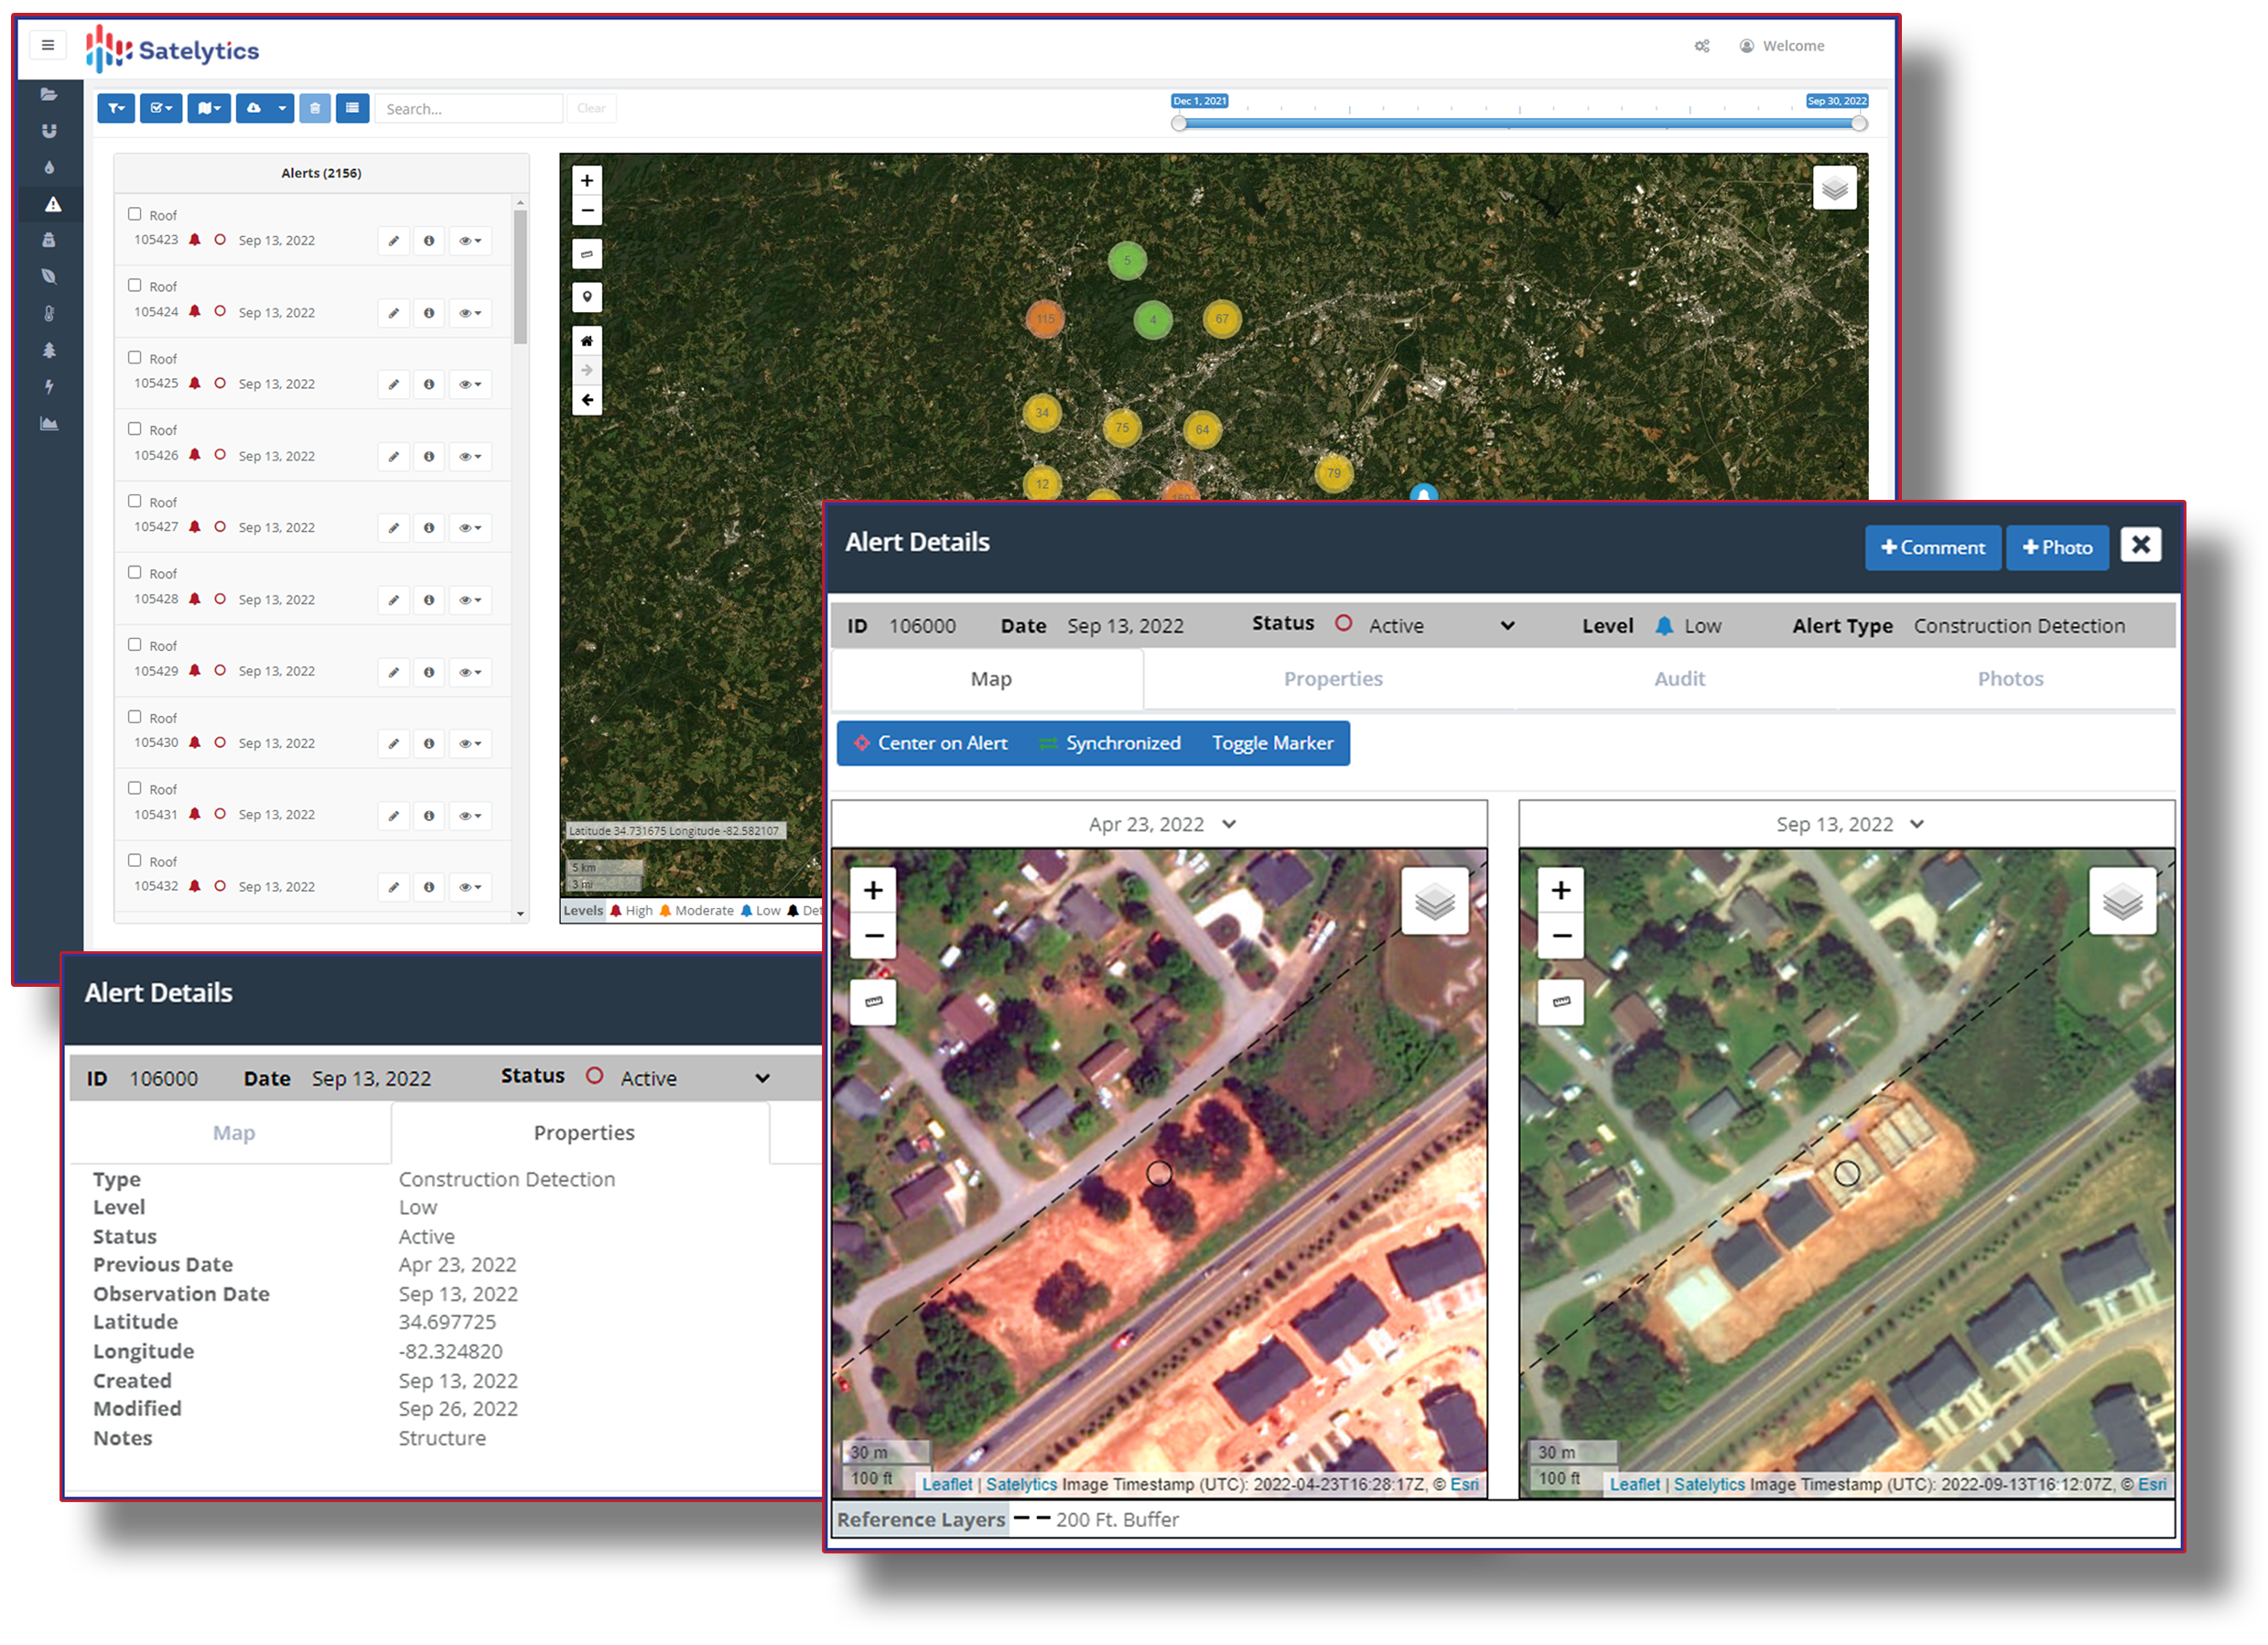
Streamline new utility connections workflow.
The same underlying imagery also proved useful for a third purpose: identifying above-ground propane tanks within the service territory. Propane tanks are a visible proxy for households and businesses not yet connected to natural gas mains. Each one represents a prospective new customer. Analysis of the price differential between propane and natural gas shows that switching customers realize meaningful annual per-connection savings that scale with total consumption, which means a systematic list of untapped propane households is effectively a targeted, self-funding sales lead list. What began as a leak-detection contract became a lead-generation engine for the commercial team, at zero incremental data-acquisition cost.
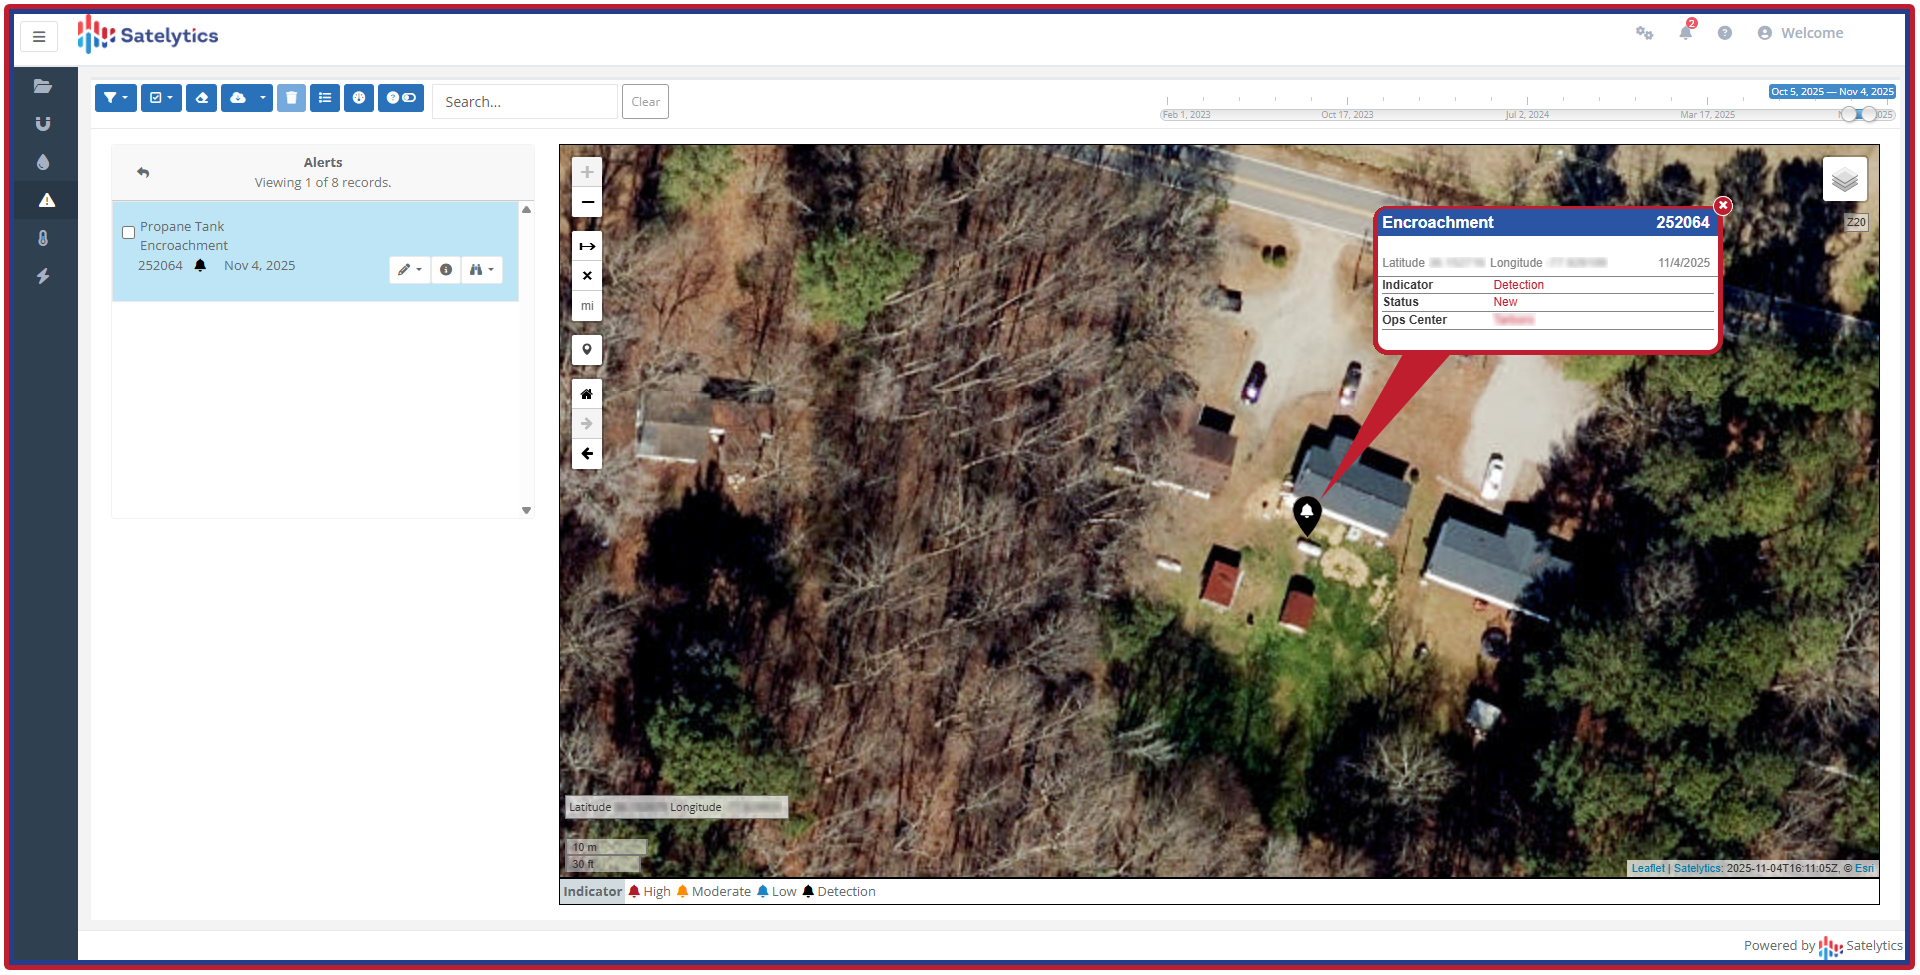
Identify new utility customer leads.
Electric T&D: from Vegetation Threats to Budget Certainty
An investor-owned electric utility initially engaged GeoAI to flag vegetation encroachment threatening transmission and distribution infrastructure. This is a well-understood risk category, since nearly a quarter of U.S. power outages are attributable to vegetation contact. The initial deliverable was point-in-time threat flags for crews to clear. The expansion came when the utility asked whether the same vegetation-height and growth-rate data could be aggregated at the circuit level rather than the individual-span level.
Aggregated circuit risk scoring let the utility move from reactive, complaint-driven trimming to a forward-looking maintenance calendar. That shift has measurable financial consequences. Industry data-driven vegetation management case studies report utilities discovering that a substantial share of circuit mileage needs little or no work in a given cycle, freeing budget for higher-risk spans, with one cooperative anticipating an 18% reduction in mileage requiring trimming once satellite-based risk analysis replaced fixed cyclical schedules. Other utilities that shifted from purely reactive to scheduled, risk-prioritized vegetation programs have cut per-mile costs from roughly $2,400 to $500, an 80% reduction. Separately, increasing trim frequency by one year on a given circuit segment has been shown to reduce vegetation-related outages by roughly 13% per month, underscoring how much financial and reliability value sits inside better-timed, better-targeted work rather than more work overall. The circuit-level view also let the utility’s finance organization move vegetation spend from an unpredictable emergency-response cost center to a multi-year, board-defensible capital and O&M plan, improving both out-year budgeting accuracy and workforce scheduling.
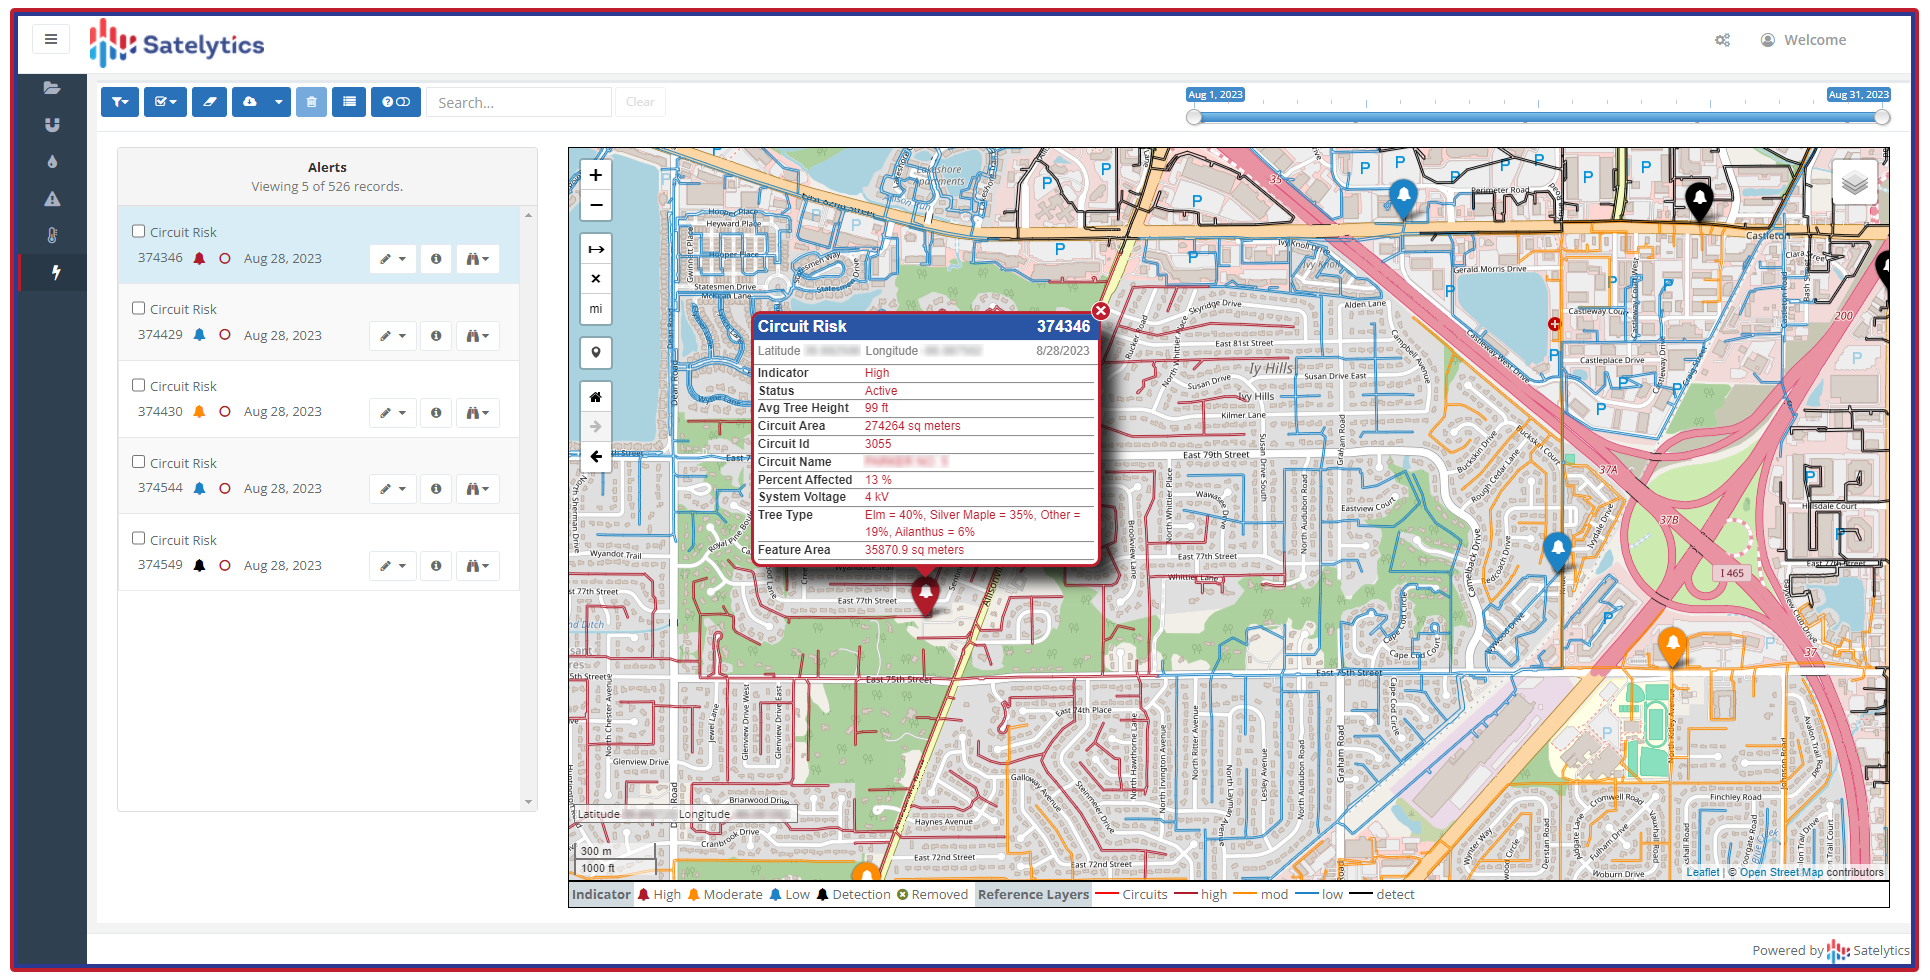
Circuit risk analysis transforms reactive to proactive actions.
Pipelines: from Leak Detection to Threat Prevention
A liquids pipeline operator’s contract focused on detecting hazardous-liquid leaks along its network, driven by these economics: implementing GeoAI monitoring across a pipeline segment can cost as little as $50,000 against a potential $2 million-plus single-incident liability. Having proven the value of continuous surface monitoring for leaks, the operator asked whether the identical imagery stream could also flag unauthorized surface disturbance near right-of-way corridors (excavation, encroachment, or unpermitted activity that historically was discovered only after damage occurred). This shifted the operator from a purely reactive damage-response posture to a proactive one, catching threats to the pipeline before contact occurred rather than after.
The second unexpected use came from applying vegetation-health analytics to the operator’s liquids network. Degraded vegetation health directly above buried gas pipeline segments running through the same corridor can indicate subsurface natural gas leaks stressing root systems. The operator credits this vegetation-health overlay with identifying several small natural gas leaks that would otherwise have gone unnoticed until routine patrol or complaint. Given that leak repairs typically cost between $2,000 and $7,000 each when addressed on a normal maintenance cycle rather than after escalation, early identification converts a routine O&M line item into a controlled, budgeted repair rather than an emergency response.
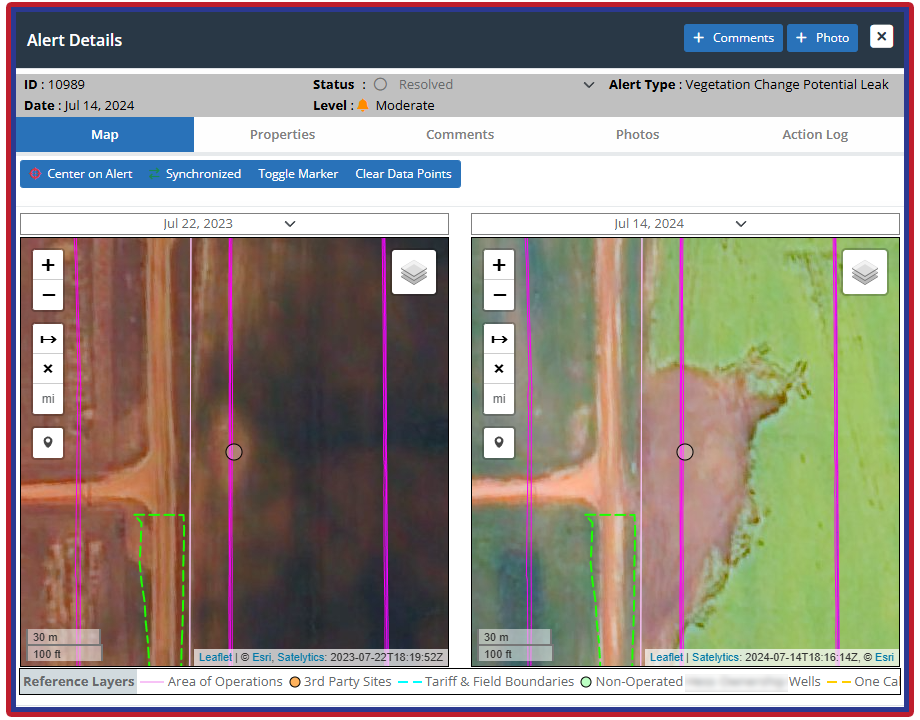
Spot small gas leaks via surrogate indicators.
Water: from Water Body Monitoring to Nutrient Source Tracking
A regional water management district initially contracted Satelytics for chemical water quality measurement across critical source-water bodies feeding potable water systems. One municipal water system’s own accounting found that excess nutrients in a single source lake generated more than $70 million in total treatment-related costs, including tens of millions in required treatment plant upgrades. A 1% reduction in source-water nitrogen concentration has been estimated to generate over $120 million per year in treatment-cost benefits nationally.
Having validated the water-body monitoring, the district extended the same chemical-detection algorithms from water to land, tracking seasonal changes in land-based chemistry to identify the geographic sources of elevated nutrient loading before it reached critical water bodies. This land-based extension turns a downstream compliance measurement into an upstream source-attribution tool, letting the district target watershed interventions at the actual contributing parcels rather than treating symptoms at the intake structure.
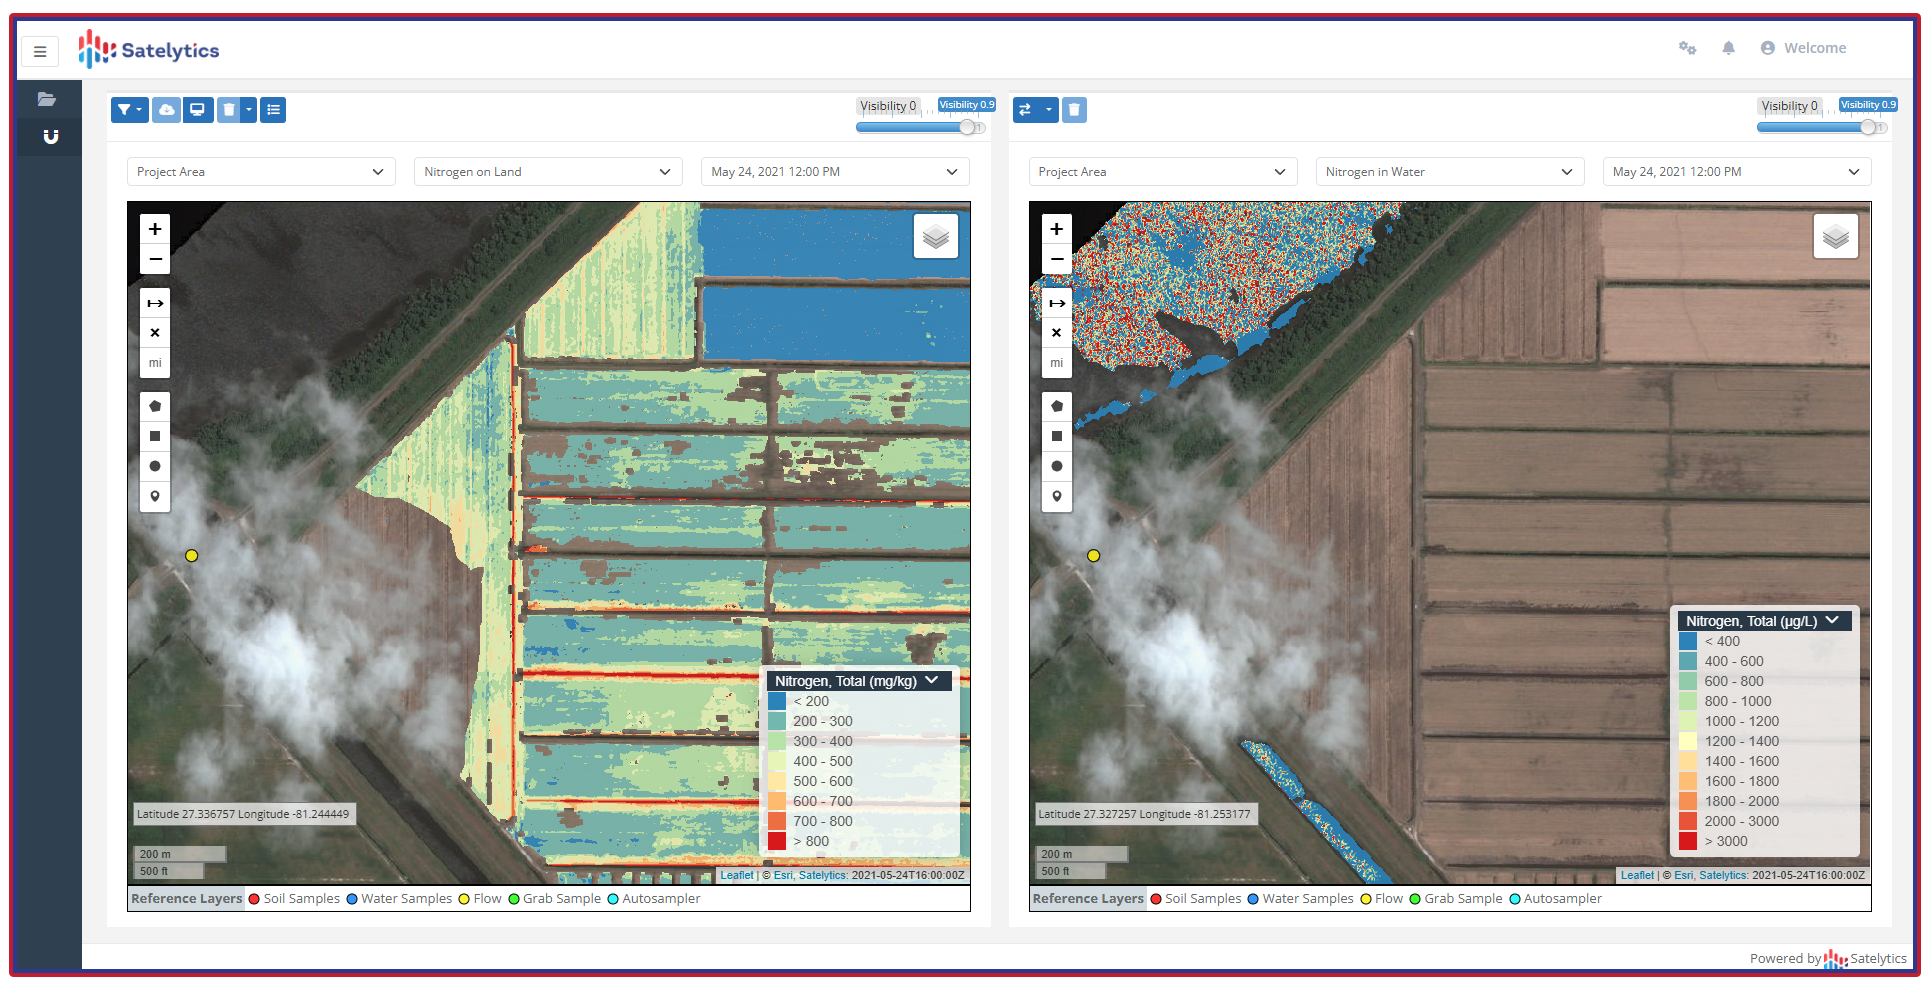
Measure fate and transport of chemicals.
The Pattern behind the Pattern
Across every example, the second and third use cases were not part of the original procurement conversation. They emerged because the underlying dataset, made valuable via multispectral analytics, contains far more signal than any single algorithm extracts on its own. Reanalyzing that same data with additional analytics is a negligible cost measured in software configuration, not new capital expenditure, new sensors, or a new procurement cycle. That is the real financial argument for a multi-solution GeoAI platform. Operators that treat their geospatial contract as a single-purpose compliance tool are leaving discovered, quantifiable value on the table that their peers are already capturing.