- Problem: Monitor water quality changes.
- Solution: Go beyond scheduled sampling points.
- Benefit: Find emerging problems sooner, feed compliance program with data.
A treatment plant can be instrumented down to the minute and still be surprised by the water arriving at its intake. Utilities operate plants, but water quality is shaped across landscapes. Runoff carries sediment and nutrients, algae move with wind and current, and discharged effluent disperses beyond the outfall. Much of that behavior occurs outside the fence line and outside a conventional sampling program’s field of view.
That blind spot matters at national scale. U.S. public-water systems withdrew about 39 billion gallons per day in 2015, serving 283 million people. 61% of those withdrawals came from surface water. On the wastewater side, EPA reports 17,544 publicly owned treatment works serving 270.4 million people, while documented clean-water infrastructure needs total $630.1 billion over 20 years. At that scale, better situational awareness helps deploy people, chemicals, sampling budgets, and capital where they can change an outcome.
The Problem Is Spatial
Compliance-oriented sampling is indispensable, but it is designed to answer specific questions at specific locations. EPA guidance describes effluent monitoring as sampling final effluent after treatment, at a representative point before discharge. Receiving-water monitoring may then assess downstream effects.
Those measurements establish defensible concentrations and compliance. They do not automatically reveal the size of a sediment plume, the upstream branch feeding a bloom, or the shoreline reach where conditions changed after a storm.
The central management insight is simple: a sample is precise, but a water-quality event is spatial. A bottle characterizes one place and time. A calibrated image shows where conditions differ across a reservoir, river reach, lagoon, or receiving water. GeoAI (a.k.a., AI-powered geospatial analytics) converts repeat imagery into mapped patterns, trends, and anomalies. It is “sampling from space,” but it is also a decision layer showing where conventional sampling will be most valuable.
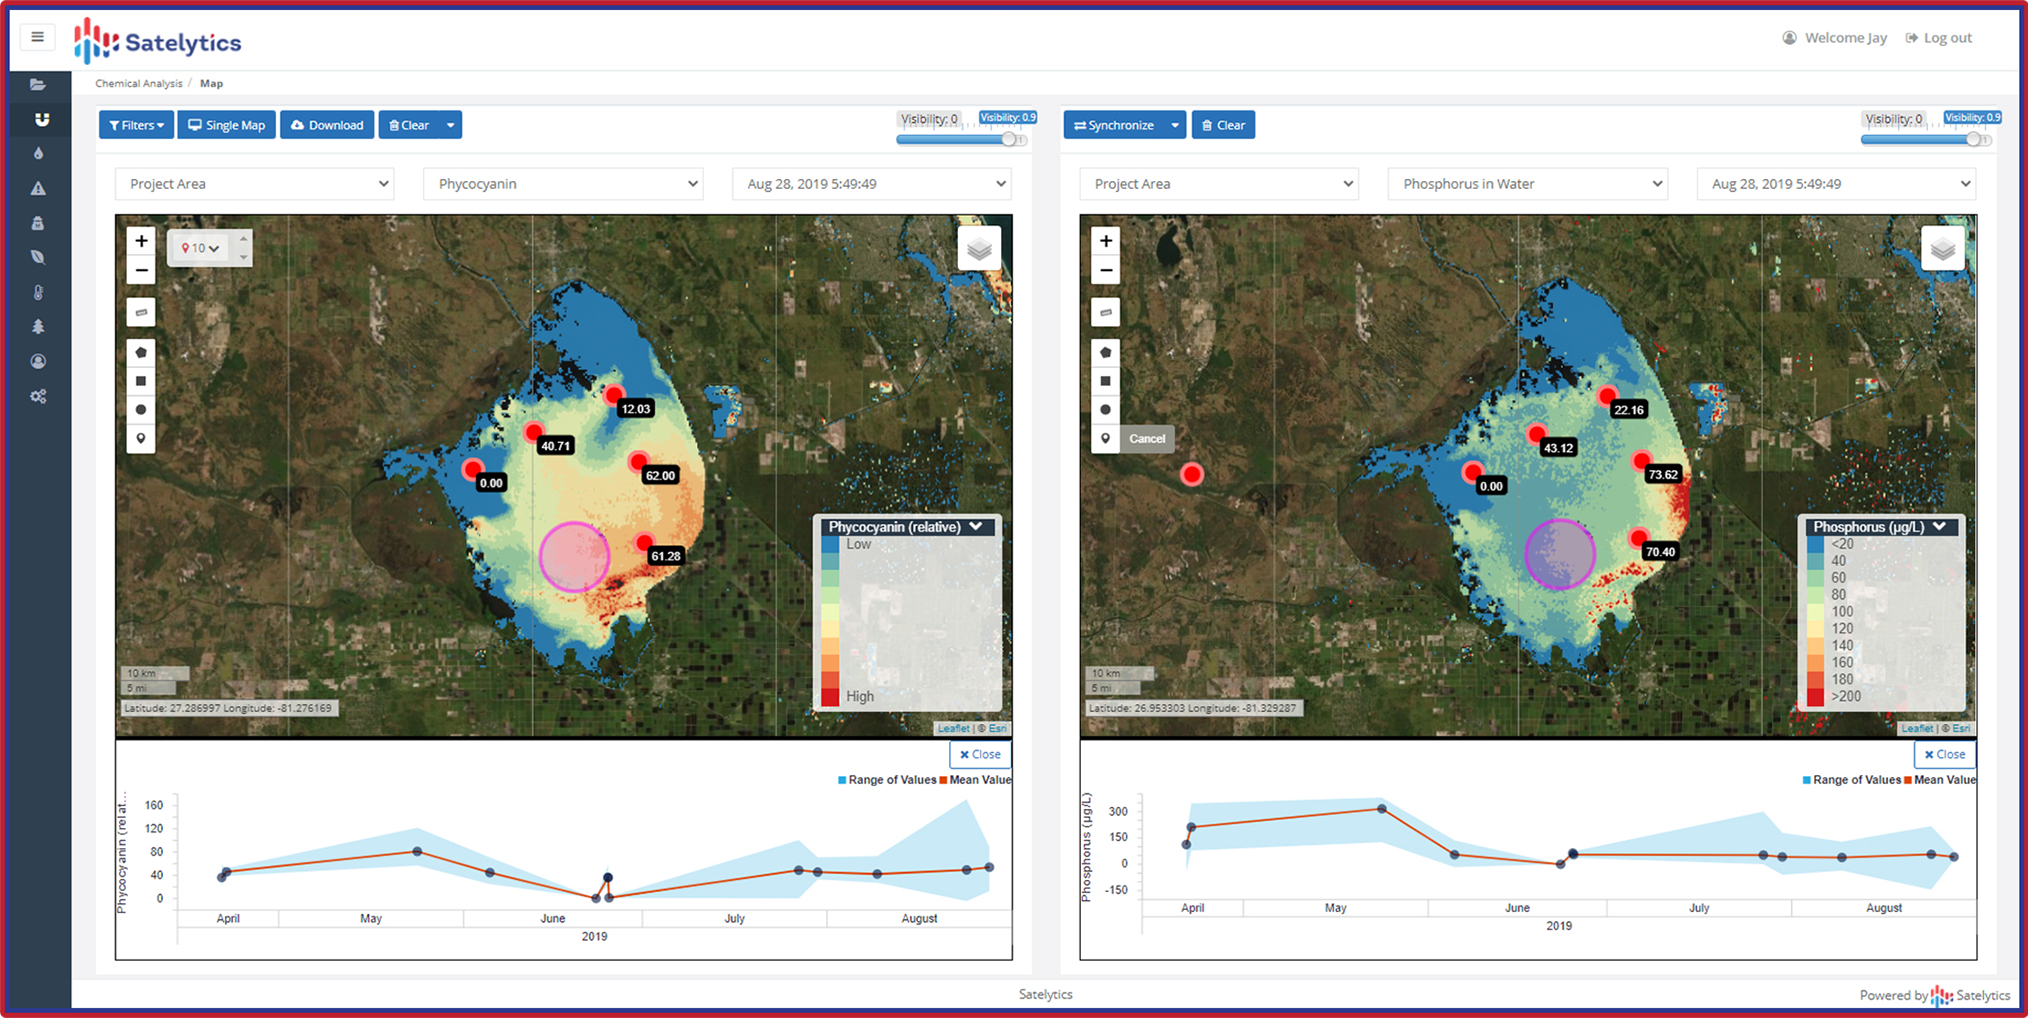
Monitor chemical, biological, and physical constituents in source water.
Source Water: Buy Time
The need is visible in the nutrient data. EPA’s latest national assessments found 42% of river and stream miles in poor condition for phosphorus and 44% in poor condition for nitrogen. GeoAI can flag bloom-like change, map its extent, indicate movement toward an intake, and prioritize confirmatory toxin sampling. Operators gain time to inspect pretreatment conditions, adjust treatment strategies, protect filter performance, and increase laboratory testing before source-water deterioration becomes a finished-water emergency.
The cost of late visibility is not theoretical. During the 2014 Lake Erie crisis, a “do not drink” advisory affected roughly 500,000 Toledo-area customers for more than two days. EPA’s compilation of nutrient-related costs cites communities spending millions on treatment upgrades, additional chemicals, and monitoring. Toledo had previously reported activated-carbon costs of roughly $3,000 to $4,000 per day during bloom events. By contrast, analysis of a 2017 Utah Lake bloom estimated that satellite-enabled earlier detection avoided approximately $370,000 in health and productivity costs. Without the satellite signal, detection was projected to occur about seven days later, potentially exposing about 8,000 additional visitors.
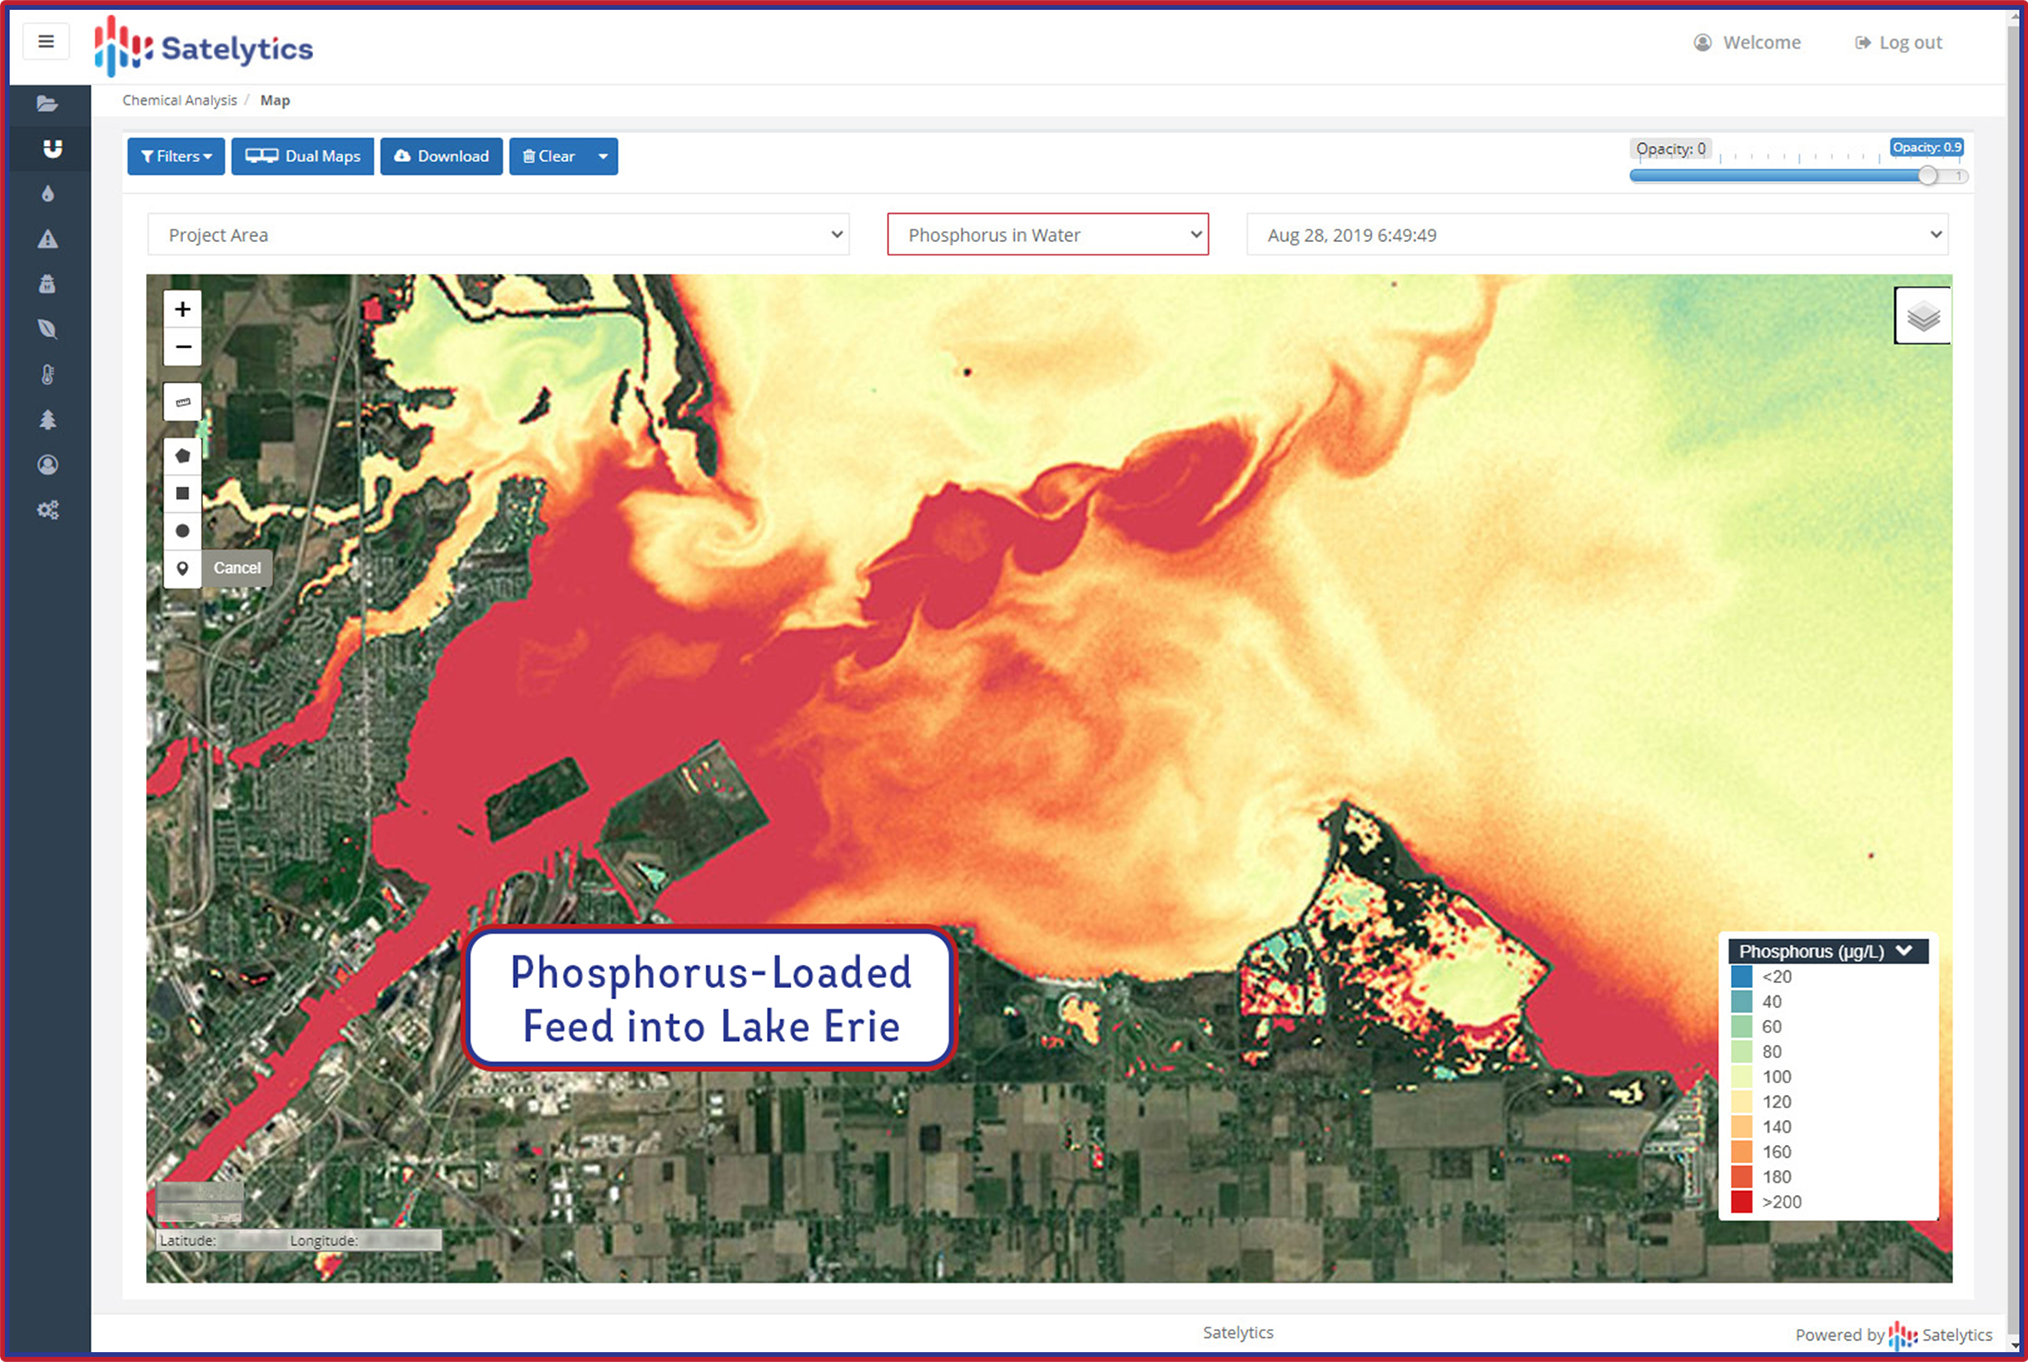
Big-picture tracking of nutrient sources.
Those numbers show the mechanism: earlier spatial awareness changes the decision clock, supporting avoided exposure, better-timed treatment changes, focused field deployment, and upstream intervention.
Effluent: Look Past Outfall
Wastewater managers face the inverse problem. At the plant, they know the quality and volume of the effluent. Beyond the outfall, dilution, currents, temperature, suspended solids, biological response, and shoreline geometry determine where the discharge goes and what it affects. A compliant result at the sampling point and a visible receiving-water response answer different questions. Managers need both.
GeoAI has already demonstrated this wider view. In Southern California, researchers used Landsat thermal data to detect the surface-temperature signature of a wastewater plume and optical imagery to examine chlorophyll-a response during a treatment-plant diversion. EPA’s monitoring plan for the Massachusetts Bay outfall likewise recognized analysis of satellite imagery as a way to evaluate spatial variation and changes between vessel-based surveys, while retaining continuous sensors and discrete samples for calibration.
For plant managers, the value is operational. A mapped plume can target boats and crews, distinguish expected dispersion from an unusual pattern, compare conditions around maintenance or wet weather, and document persistence. A growing baseline also shifts discussions with regulators and communities from isolated readings to a time-stamped picture of extent, direction, and duration.
A Better Monitoring Loop
The strongest programs do not choose between GeoAI and traditional field samples. They build a closed loop:
- Baseline: Use historical imagery, operating data, weather, flow, and field samples to establish normal spatial and seasonal behavior.
- Detect: Screen new imagery for departures in temperature, turbidity, suspended sediment, algal pigments, surface vegetation, or other validated observables.
- Triage: Rank anomalies by proximity to intakes or outfalls, rate of change, affected area, recurrence, and operational consequence.
- Verify: Send crews to high-information locations and use laboratory analysis for constituents that imagery cannot directly confirm.
- Act and learn: Adjust treatment, investigate sources, document plume behavior, and feed verified results back into site-specific models.
This approach changes the unit of productivity. Instead of asking, “How many samples did the team collect?” managers can ask, “How much uncertainty did each sample remove?” Useful performance measures include:
- Warning time before intake impact,
- Percentage of field samples directed by anomalies,
- Time from detection to verification,
- Acres or river miles screened per labor hour,
- Recurrence of upstream hotspots,
- Receiving-water plume area and duration, and
- Treatment changes made before threshold conditions arrived.
Know the Boundaries
The practical question is not whether GeoAI replaces a laboratory. It does not. The question is whether a utility should continue asking a few isolated samples to represent an entire dynamic waterbody. Federal agencies already use satellite-based systems to screen more than 2,000 large U.S. lakes for cyanobacterial conditions, demonstrating that wide-area observation has moved from experiment to operational practice.
In an era of constrained capital and increasingly variable water conditions, the most valuable new “samples” may be the intelligence that tells a utility exactly where and when to take the next ones.