
- Problem: Labor-intensive monitoring.
- Solution: Target your resources better.
- Benefit: Positive ROI, lower total costs.
Ask any energy infrastructure manager how they monitor their assets, and you’ll likely hear a familiar story: foot patrols, truck rolls, scheduled aerial flyovers, and a small army of inspectors covering thousands of miles of pipelines, transmission lines, and rights-of-way. This is business-as-usual, and it has worked well enough for decades. But “well enough” is an increasingly expensive standard when the alternative, geospatial analytics, can cover the same ground faster, cheaper, and more consistently.
The choice between manual, labor-intensive monitoring and satellite-based geospatial analytics is not really a choice between old and new technology. It’s a choice between reactive and predictive risk management, and the numbers make the case with unusual clarity.
The True Cost of Business-as-Usual
Manual inspection programs carry costs that rarely show up as a single line item, which is exactly why they’re so easy to underestimate. The U.S. Department of Energy estimates that power outages cost the American economy $150 billion annually. Vegetation encroachment, one of the most common triggers for outages, causes 25% of all utility outages, with trees responsible for 92% of weather-related power outages. Utilities already spend $6-8 billion annually on vegetation management, and that spend is largely reactive: crews trim on fixed cycles rather than where risk is actually concentrated.
Pipeline operators face a parallel reality. PHMSA tracked over 12,300 pipeline incidents between 2000 and 2019, totaling more than $9.4 billion in documented costs, an average of roughly $471 million per year, and that figure only counts self-reported costs. It excludes legal fees, reputational damage, and the downstream cost of stalled right-of-way negotiations. When incidents do occur, the remediation bills are severe: TC Energy’s 2022 Keystone spill cost roughly $480 million in cleanup, plus tens of millions more in penalties and compliance upgrades.
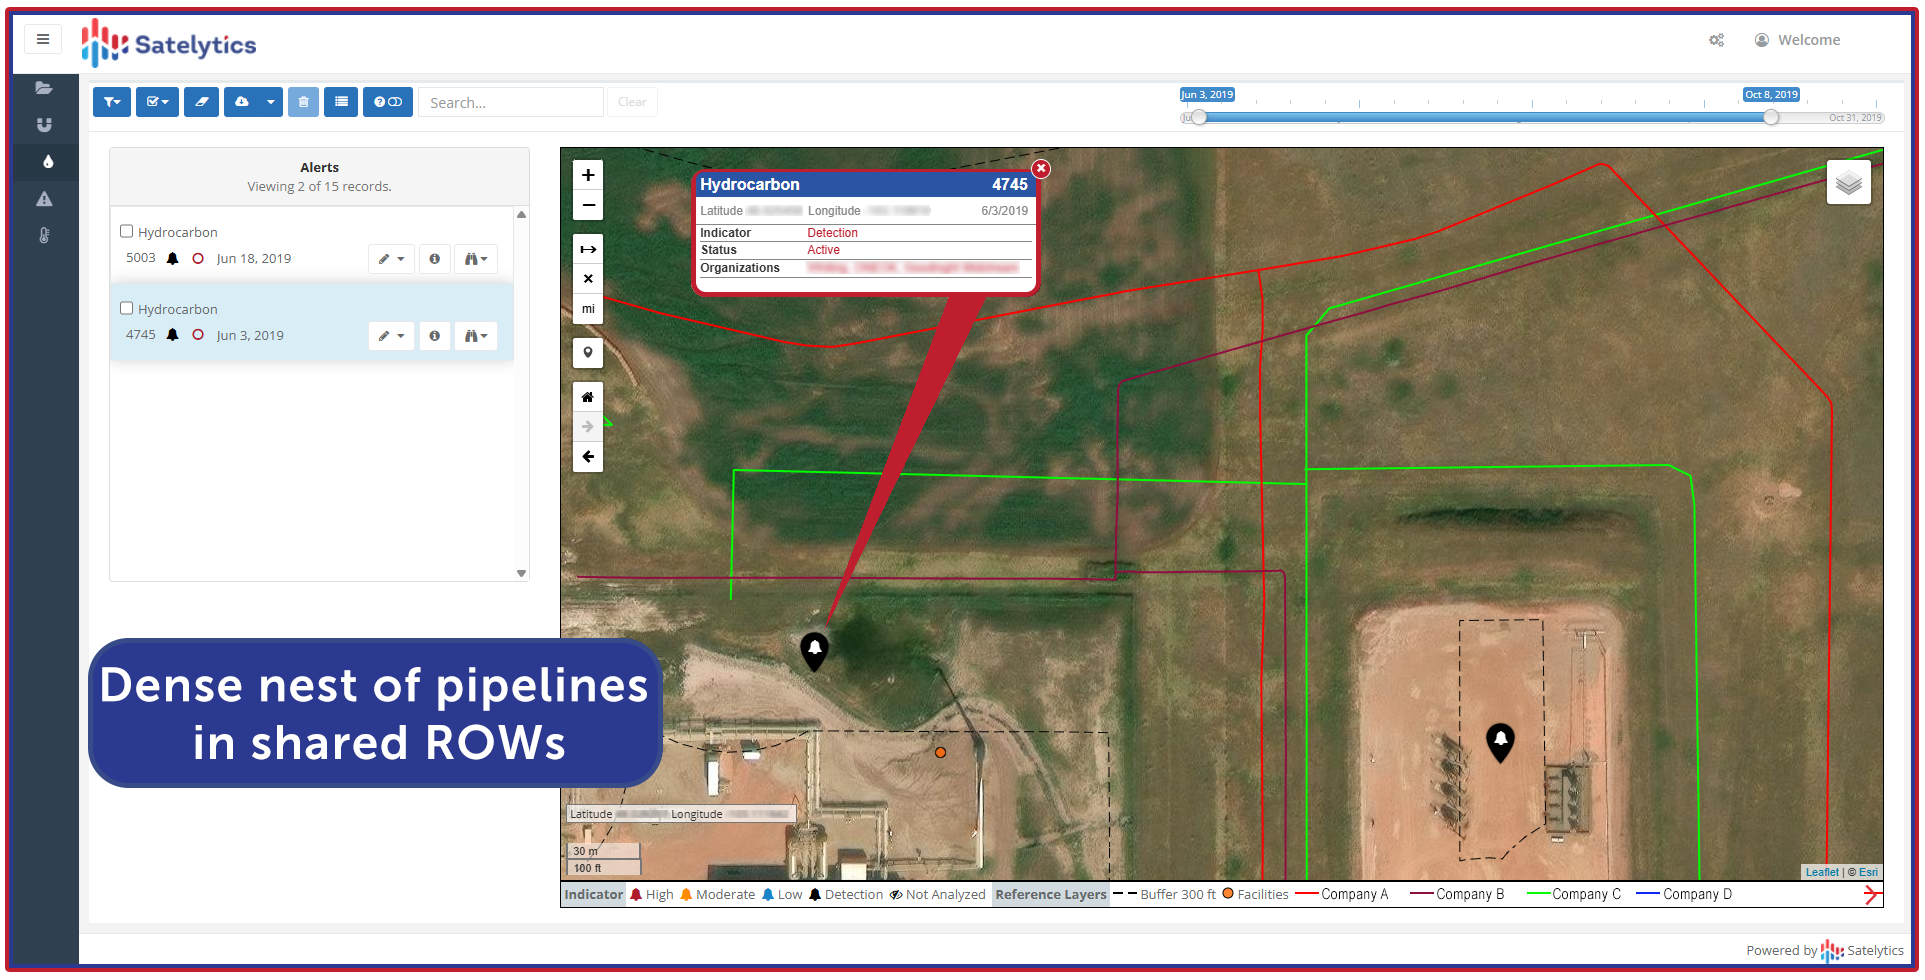
Specificity on shared rights-of-way to accurately direct field resources.
The common thread across every one of these figures is that manual, calendar-based inspection cannot see everything, everywhere, all the time. It sees what falls within a patrol’s scheduled route on a given day, and it relies on human eyes to catch what may be subtle, slow-developing, or simply out of sight.
What Geospatial Analytics Changes
Satellite-based geospatial analytics does not eliminate ground crews, drones, or SCADA systems. It changes where those resources get deployed. Rather than patrolling an entire network speculatively, satellite monitoring flags the 5-10% of network segments where problems are most likely developing, letting ground teams respond to a two-mile anomaly instead of a 300-mile corridor.
Speed matters just as much as cost. Where traditional inspection cycles can take weeks or months to complete a full network assessment, satellite systems deliver actionable intelligence within hours of image capture. In documented cases, satellite-based detection has identified pipeline releases up to five days before operators learned of the incident through their own internal systems, a gap that translates directly into fewer barrels spilled and a smaller remediation footprint.
Metrics That Move the Decision

Vegetation management offers one of the clearest before-and-after pictures. One Midwest electric cooperative that layered geospatial monitoring into its trimming program achieved an 80% cost reduction in trimming operations while cutting tree-related outages by 30% and outage duration by 45%. A separate study found enhanced, data-driven vegetation management reduced outage rates by more than 35% compared to untreated areas. These aren’t marginal gains, they represent a fundamentally different cost structure than fixed-cycle trimming applied uniformly across a territory regardless of actual risk.
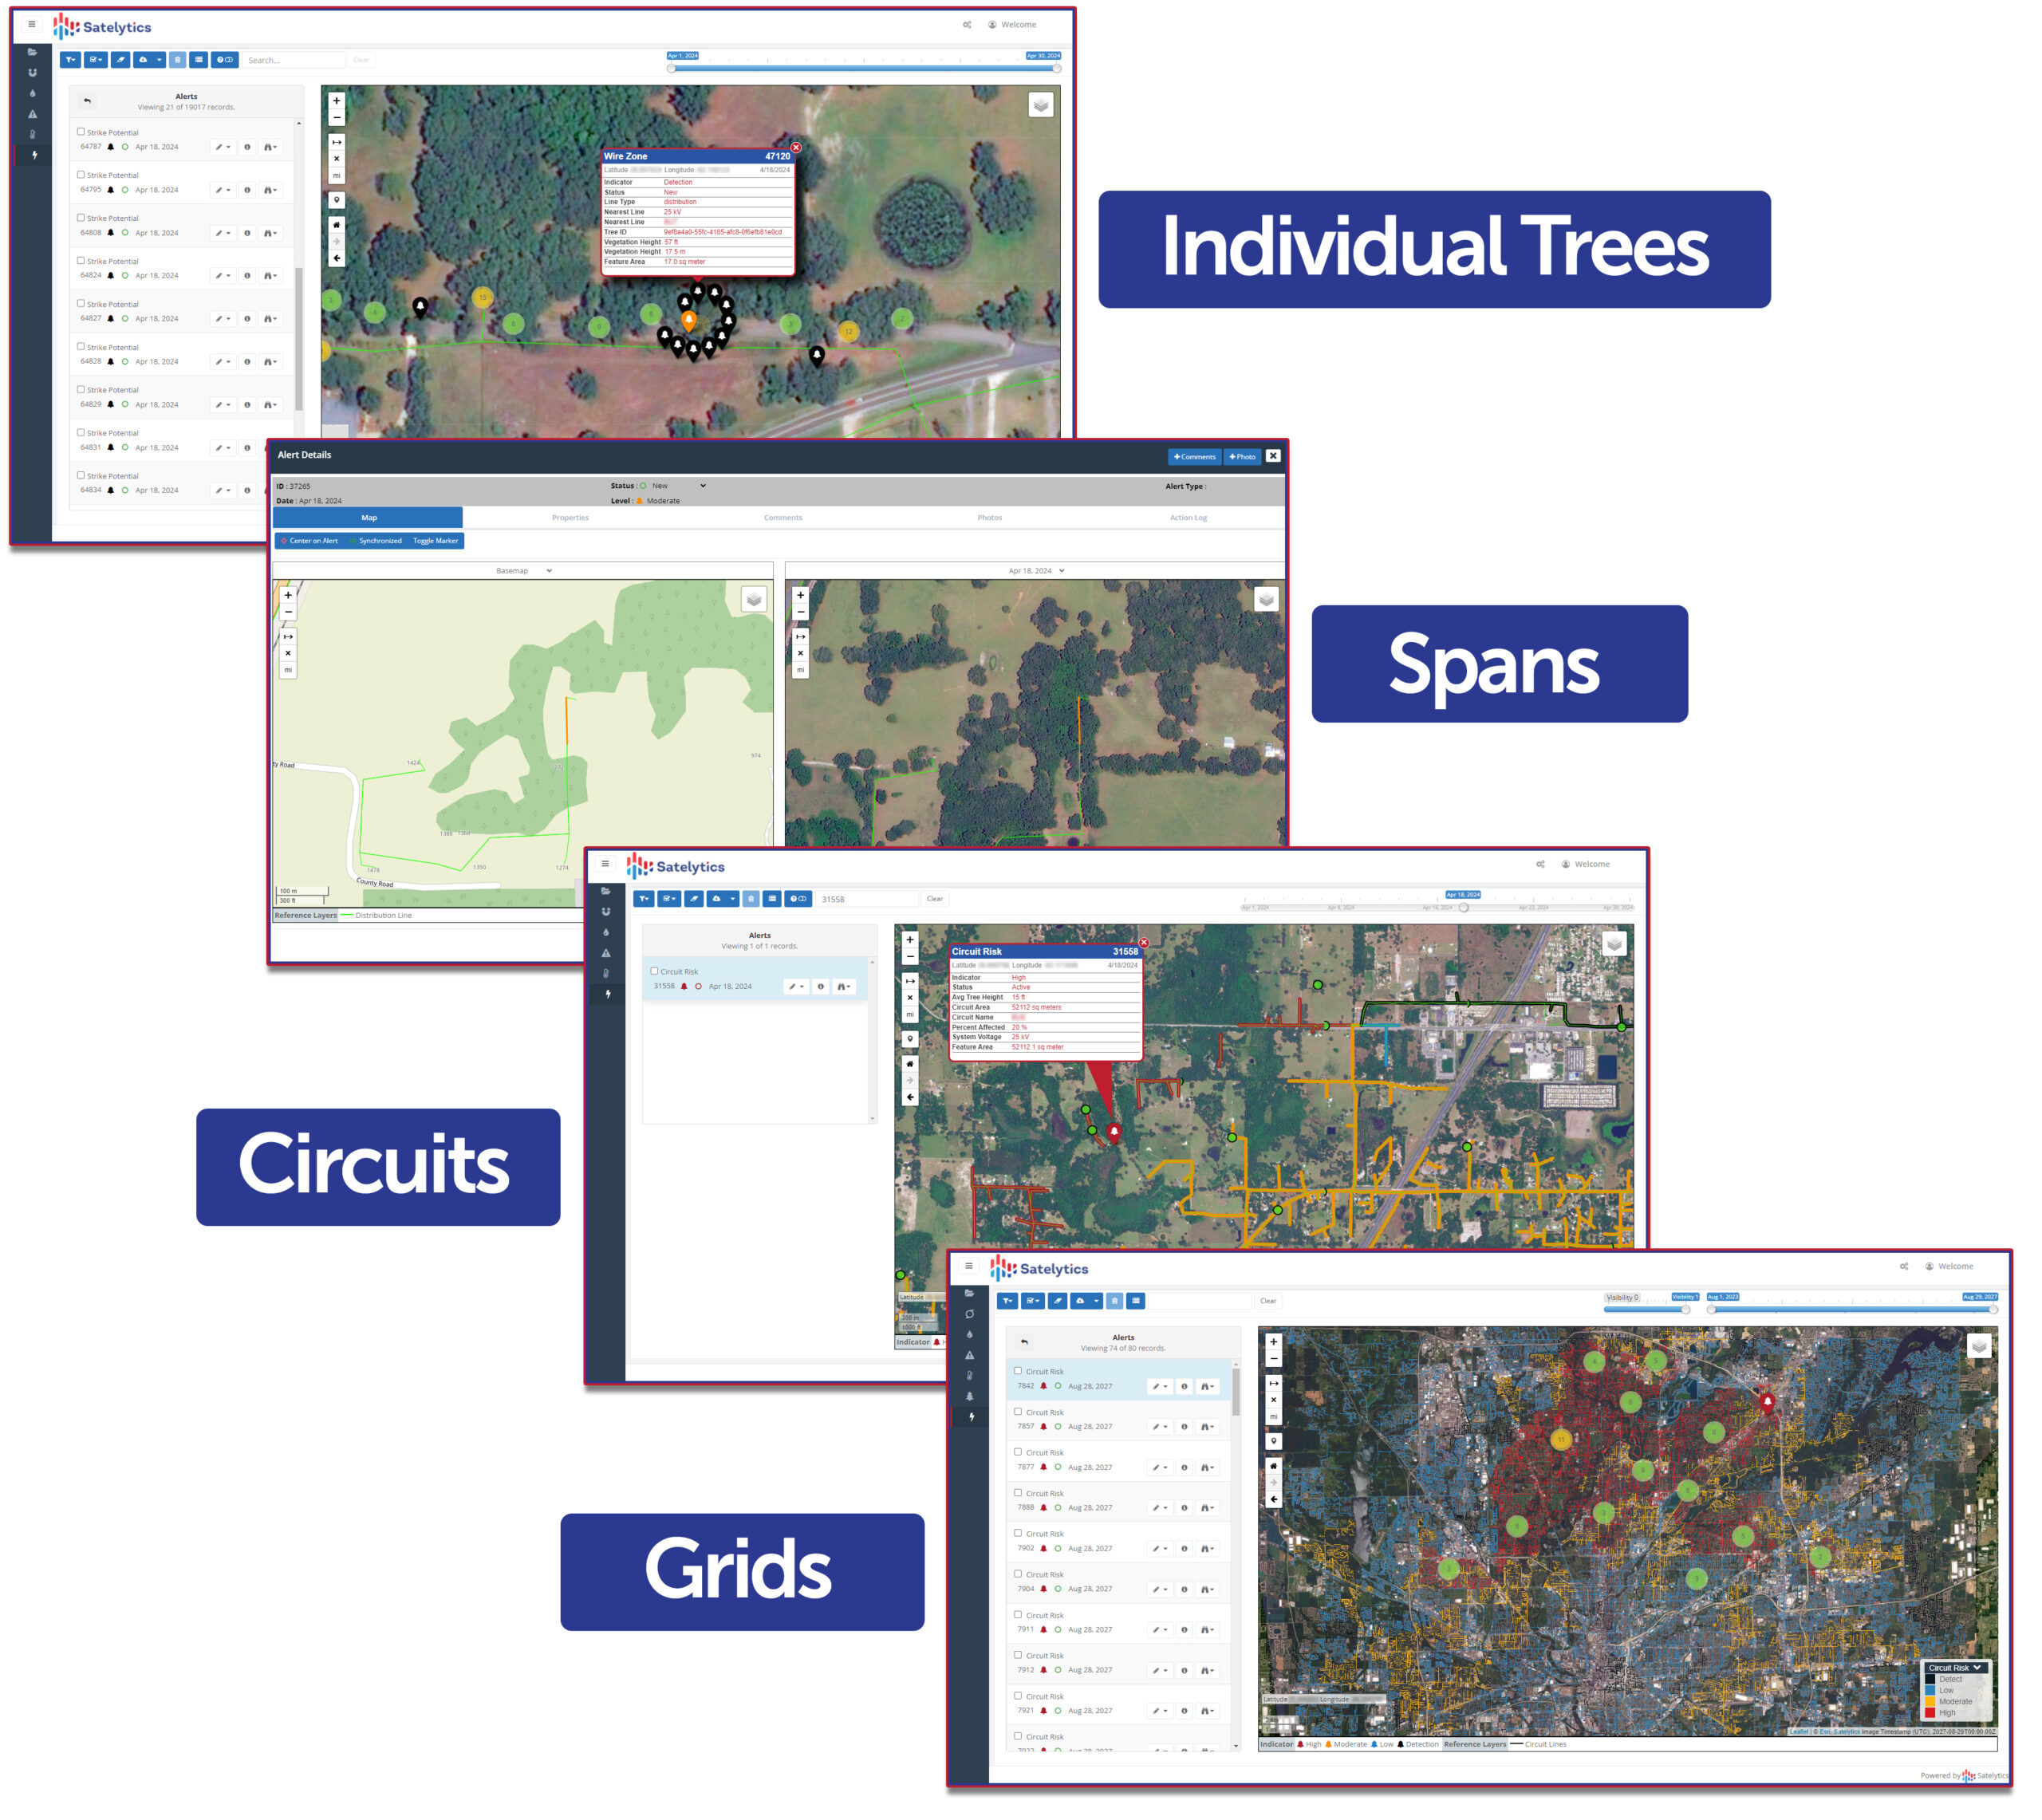
Specificity on large electrical corridors to direct vegetation management resources.
On methane, the pattern repeats. Fewer than 10% of leaks, so-called “super-emitters,” typically account for 50% or more of total network emissions. Continuous geospatial monitoring that prioritizes those leaks for repair can cut emissions by 80% or more, at a fraction of the cost of manually inspecting an entire network mile by mile.
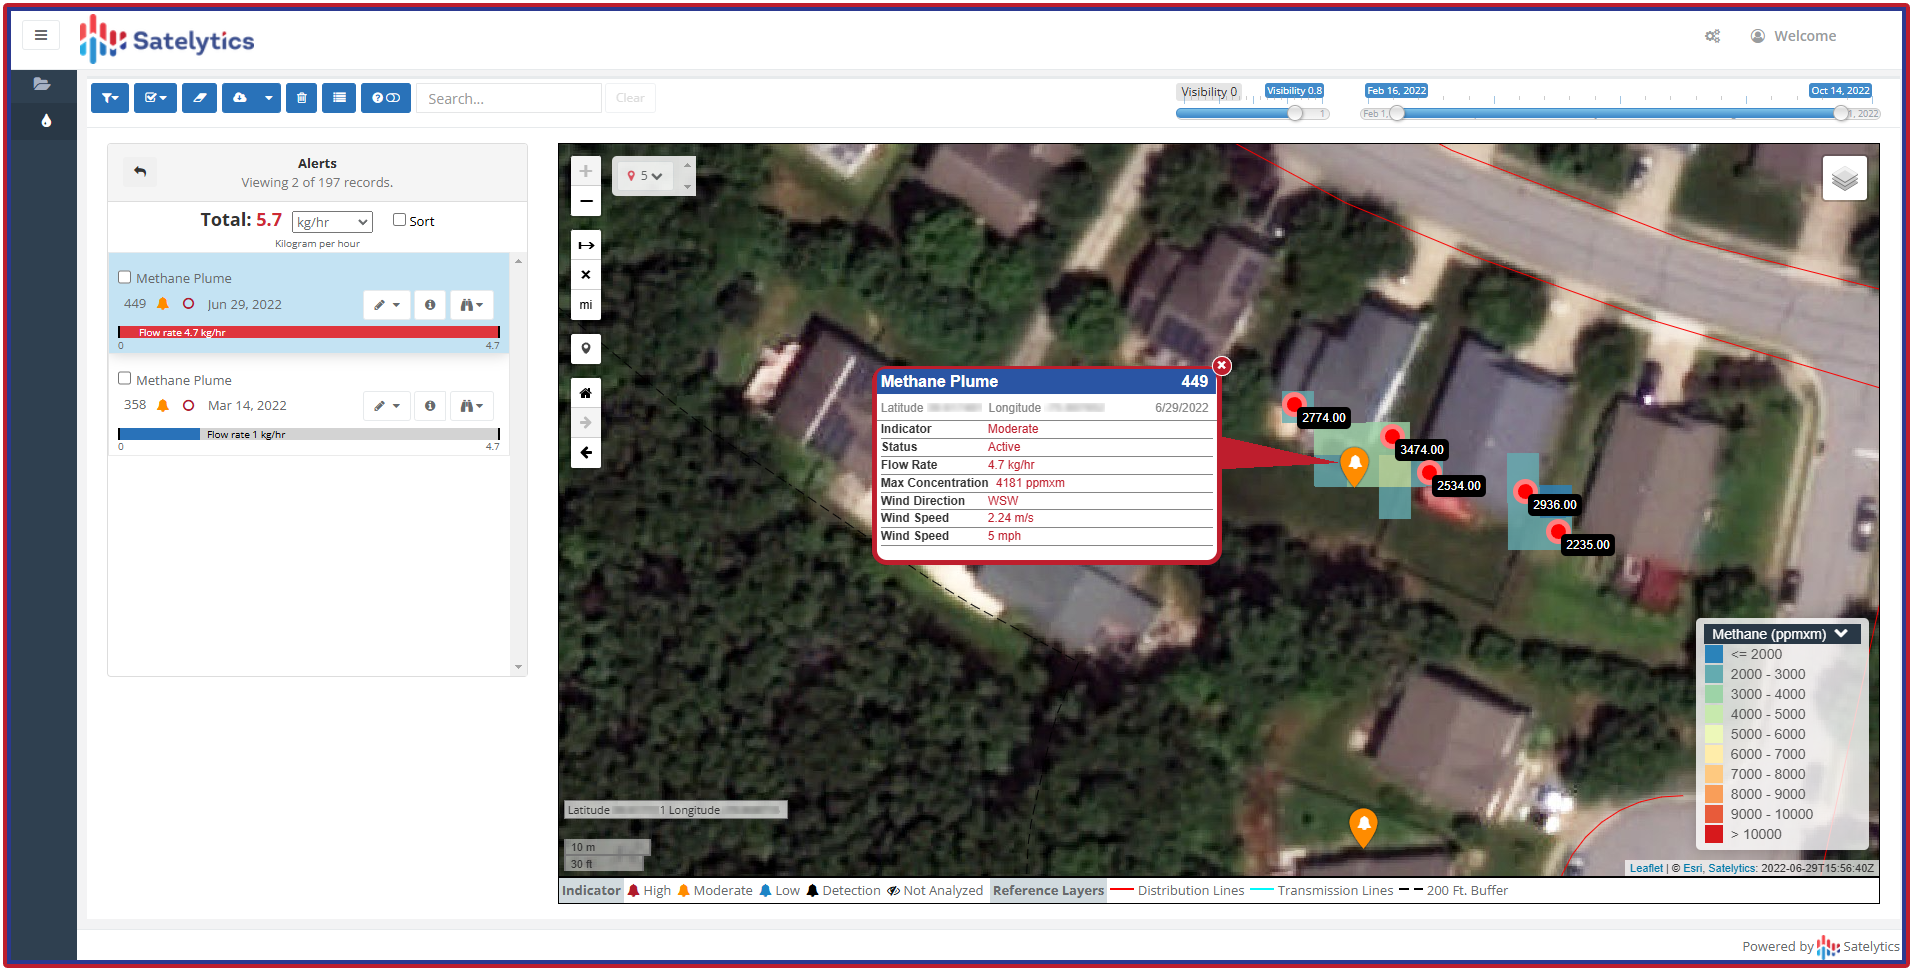
Specificity on gas distribution networks to direct LDAR teams.
The False-Positive Problem Nobody Talks About
One of the least-discussed costs of business-as-usual monitoring is wasted attention. Traditional monitoring systems, whether internal SCADA/CPM setups or ground-based sensors, can generate false-positive rates that consume 30% of operational teams’ workdays. That’s nearly a third of skilled labor spent chasing artifacts instead of real threats. Geospatial analytics, by supplying broad contextual data about surface conditions across an entire corridor, helps separate genuine anomalies from noise, so ground response gets aimed at real events rather than false alarms.
This matters because the infrastructure monitoring market itself, valued at $5.59 billion in 2024 and projected to reach $15.7 billion by 2034, is being pulled forward specifically by demand for predictive rather than reactive monitoring. The market is voting with its dollars, and the vote favors systems that reduce wasted effort as much as they improve detection.
The Real Question to Ask
With U.S. infrastructure requiring an estimated $2.6 trillion in upgrades, and pipeline upgrades alone projected at $300 billion over the next decade, the question facing energy infrastructure managers isn’t really “can we afford geospatial analytics?” It’s “can we afford to keep monitoring the way we always have?”
Business-as-usual monitoring isn’t free. It carries the accumulated cost of every incident that escalated because detection lagged, every crew-day spent chasing a false positive, and every mile inspected on a fixed schedule rather than based on actual risk. Geospatial analytics doesn’t ask operators to abandon their existing monitoring stack. It asks them to point that stack more precisely, at a lower cost, with a faster response time, and with a documented record that holds up when regulators, landowners, and boards start asking hard questions.